

Factors associated with measles resurgence in the United States in the post-elimination era
- PMID: 33420153
- PMCID: PMC7794463
- DOI: 10.1038/s41598-020-80214-3
Factors associated with measles resurgence in the United States in the post-elimination era
Abstract
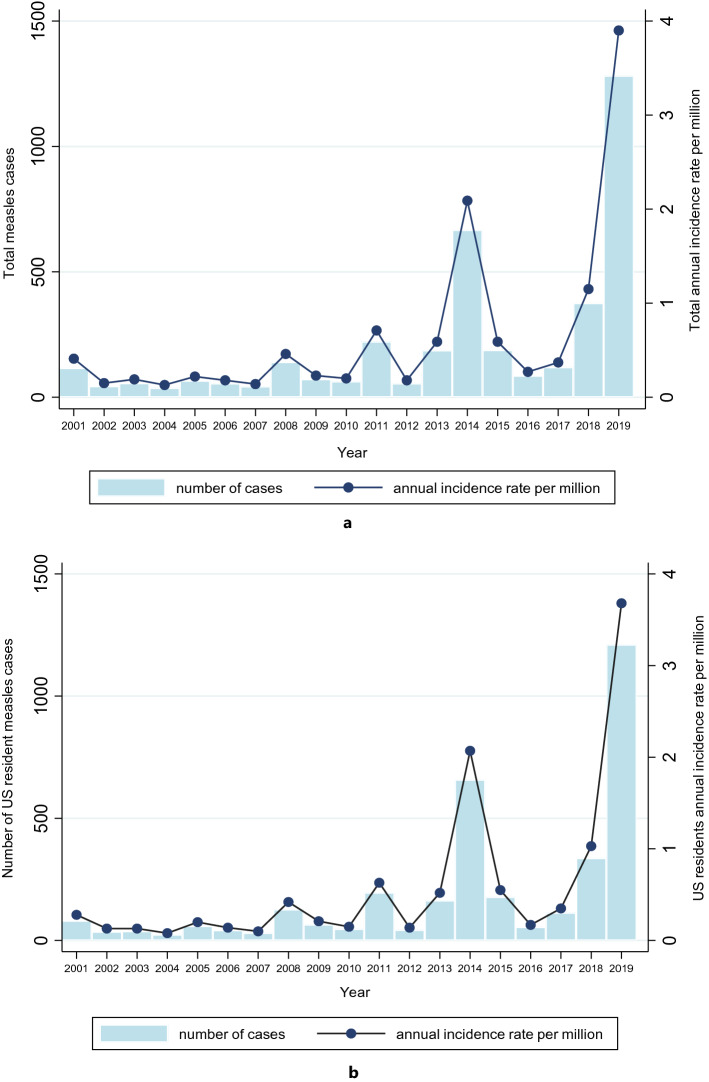
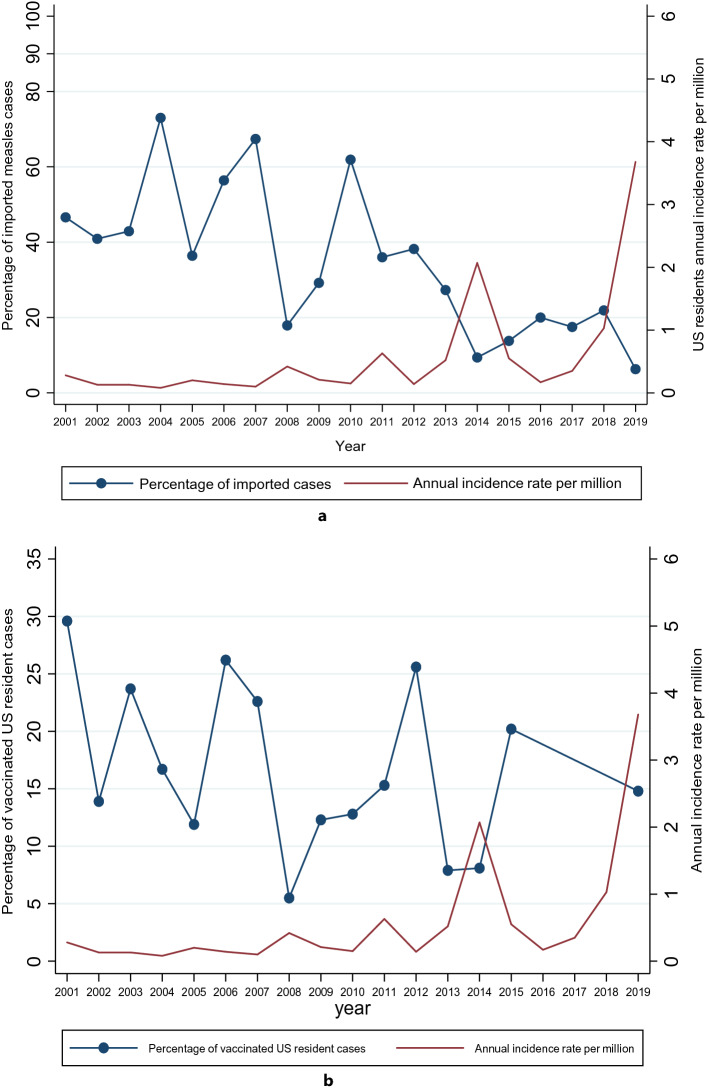
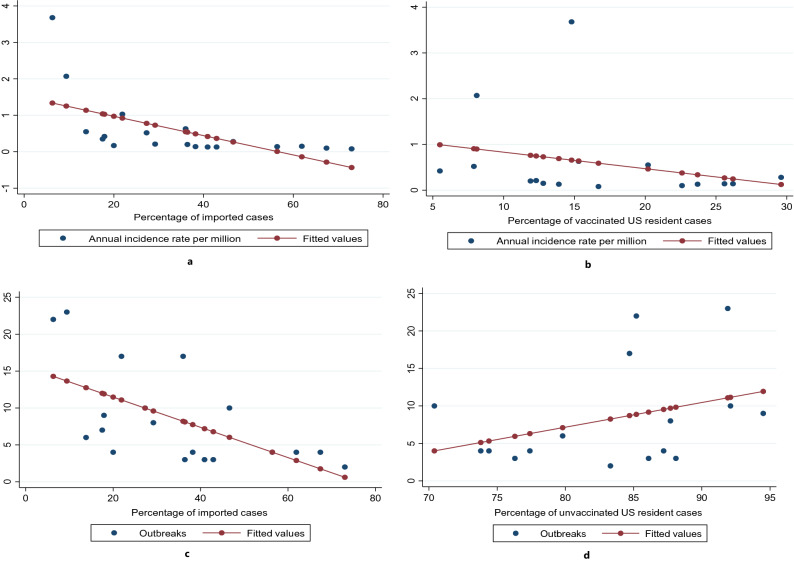
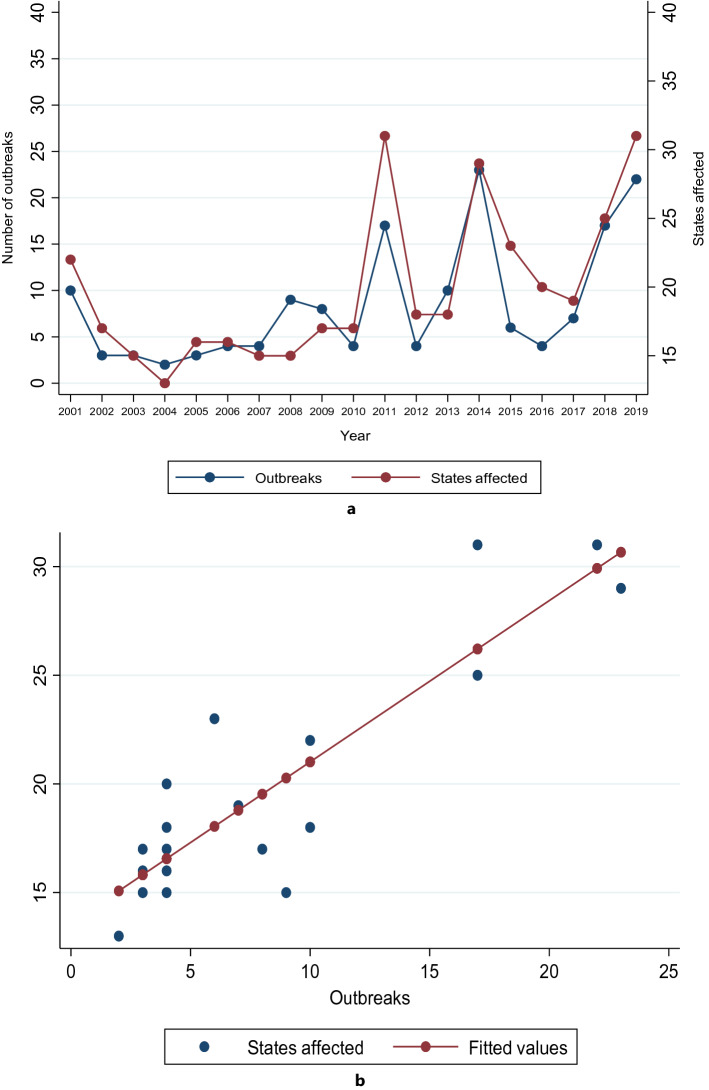
There have been growing concerns of a potential re-establishment of measles transmission in the United States (US) in the years to come. This study aims to explore potential factors underlying the resurgence of measles in the US by objectively assessing the associations between annual incidence rates (AIR), case importation, vaccination status and disease outbreaks. Data on measles transmission between January 1st, 2001 and December 31st, 2019 were obtained from the national centres for disease control and prevention (CDC) surveillance databases and other published reports. Changes in incidence rates over time were assessed by binomial regression models. Of the 3874 cases of measles in the US over the study period, 3506 (90.5%, 95% CI: 89.5-91.4) occurred in US residents. The AIR per million population in US residents over this period was 0.60 (95% CI: 0.59-0.61), with an overall significant increase over time (p = 0.011). The median percentage of imported and vaccinated cases were 36% [17.9-46.6] and 15% [12.1-23.2] respectively. There was a significant decrease in the percentage of imported cases (p < 0.001) but not of vaccinated cases (p = 0.159) over time. There was a moderate and weak negative correlation between the AIR and the percentage of imported and vaccinated cases respectively (r = -0.59 and r = -0.27 respectively). On multiple linear regression there was a significant linear association between the AIR and the number of outbreaks (p = 0.003) but not with the percentage of imported cases (p = 0.436) and vaccinated cases (p = 0.692), R2 = 0.73. Strong negative and positive correlations were seen between the number of outbreaks and the percentage of imported cases (r = -0.61) and the of number states affected (r = 0.88) respectively. Despite the overall reduction in the percentage of imported cases of measles over the past two decades, pockets of internal transmission of the disease following importation via increasing number of outbreaks in unvaccinated subpopulations, reinforced by vaccine hesitancy, account for the sustained increase in measles incidence rates in the US. Controlling indigenous transmission through efficient vaccination coverage in at-risk subpopulations and among international US travellers, improved disease surveillance and rapid outbreak containment are essential in curbing the measles resurgence.
Conflict of interest statement
The authors declare no competing interests.
Figures
References
-
- Rx for Survival . Deadly Diseases . Measles | PBS. https://www.pbs.org/wgbh/rxforsurvival/series/diseases/measles.html.
-
- Timeline|History of Vaccines. https://www.historyofvaccines.org/timeline#EVT_100502.
-
- Measles|History of Measles|CDC. https://www.cdc.gov/measles/about/history.html (2019).
-
- Pinkbook|Measles|Epidemiology of Vaccine Preventable Diseases|CDC. https://www.cdc.gov/vaccines/pubs/pinkbook/meas.html (2019).
-
- CDC. Current Trends Measles --- United States, 1990. MMWR40, 369–372 (1991). - PubMed
MeSH terms
Substances
LinkOut - more resources
Full Text Sources
Other Literature Sources
Medical
Miscellaneous
