. 2021 Jan 8;11(1):90.
doi: 10.1038/s41598-020-79703-2.

Neonatal mice resist Plasmodium yoelii infection until exposed to para-aminobenzoic acid containing diet after weaning

Affiliations

Neonatal mice resist Plasmodium yoelii infection until exposed to para-aminobenzoic acid containing diet after weaning

Marcela Parra et al. Sci Rep. .

Abstract

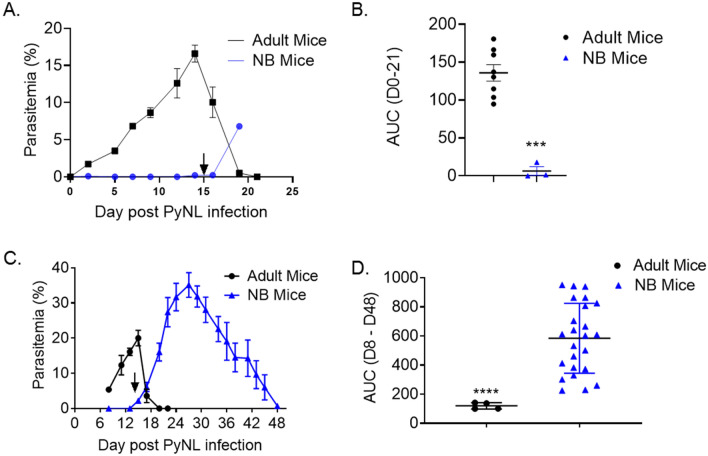
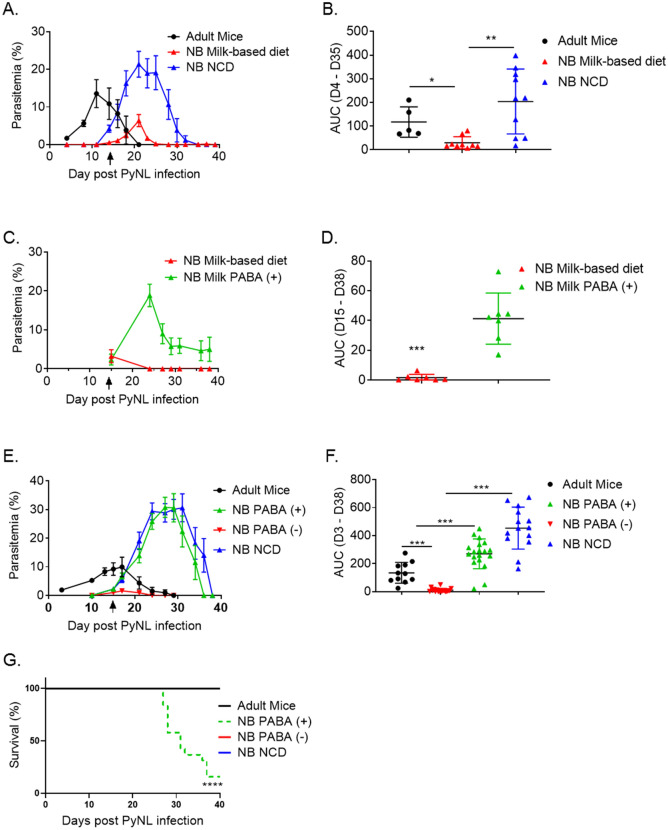
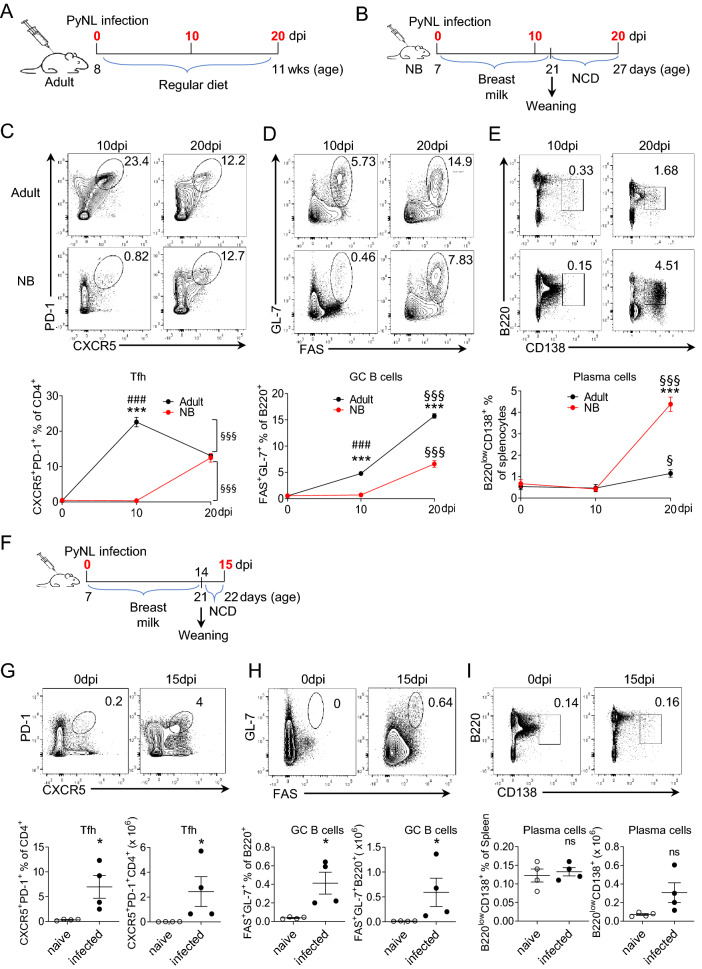
We developed a newborn (NB) mouse Plasmodium yoelii NL infection model to study malaria in early age. Surprisingly, the onset of parasitemia in P. yoelii challenged NB mice was delayed compared to adults and coincided with the weaning date when weanlings switched from maternal milk to normal chow diet. Also, compared to adult mice, parasitemia resolved much later (48 days vs 20 days post challenge) and the peak parasitemia was twice as high in weanlings. Concurrently, weanlings' germinal center reaction was delayed and diminished compared to adult mice. Maternal milk is deficient in para-aminobenzoic acid (PABA), which is required for de novo folate synthesis by Plasmodium. Suggesting a possible role for the protection afforded by PABA-deficient maternal milk, mice fed with a PABA-deficient diet after the weaning continued to control parasitemia. Despite the reduced parasitemia, these mice developed robust T follicular helper (Tfh) responses and were protected from a second P. yoelii challenge. The NB malaria model provides mechanistic insight into the human infant malaria manifestations where a diet solely based on breast-feeding reduces the incidence of severe malaria in infants. NB mice experiments also support further studies to investigate dietary PABA restriction in the management of severe malaria in infants.


Conflict of interest statement

The authors declare no competing interests.

Figures

Figure 1
Figure 1
Latency is extended and parasitemia worsened in the NB mice infected with PyNL when compared to adult mice. (A) Twenty 6 to 7-days old NB and 8 7- to 8-weeks old adult C57BL/6 mice were infected with 1 × 106 PyNL parasites. Parasitemia levels were evaluated by blood smear every 2 to 3 days after challenge until parasitemia clearance. NB mice were weaned at 21 days of age (15 days post infection black arrow). (B) AUC of parasitemia burden between the days 0 to 21 post infection shown in panel (A) are plotted. (A, B) Cumulative data (mean ± SEM) from two experiments are shown. (C) Twenty-four 6- to 7-days old NB and 4 7- to 8-weeks old adult C57BL/6 mice were infected with 1 × 106 PyNL parasites. Parasitemia levels were evaluated by blood smear on indicated time points. NB mice were weaned at 21 days of age (black arrow). (D) AUC of parasitemia burden between the days 8 to 48 post infection shown in panel C are plotted. (C, D) Cumulative data (mean ± SEM) from three experiments are shown. Student’s t-test was used to compare the AUC between groups. ***p < 0.001.
Figure 2
Figure 2
Parasitemia levels decrease when weanlings are fed with a milk-based diet or PABA-deficient diet. (A) Two groups of 6- to 7-days old NB and 7- to 8-weeks old adult C57BL/6 mice were infected with 1 × 106 PyNL parasites. Five adult mice were fed with NCD throughout the experiment. At the weaning time point (day 21 post birth, black arrow), one group of weanlings were fed with milk-based diet for 2 weeks, and the other group with NCD. The number of mice in the milk-based diet and the NCD groups were 11 and 10, respectively. Parasitemia levels were assessed by blood smears on indicated time points until clearance. (B) AUC of parasitemia burden between days 4 to 35 post infection shown in panel A are plotted. (A, B) Cumulative data (mean ± SEM) from two experiments are shown. (C) Two groups of 6- to 7-days old NB mice, each group containing 7 mice, were infected with 1 × 106 PyNL parasites. NB mice were weaned at day 21 post birth (black arrow) and were fed with milk-based diet or milk-based diet containing PABA (PABA (+)) for 23 days. Parasitemia levels were evaluated by blood smears on indicated time points. (D) AUC of parasitemia burden between days 15 to 38 post infection shown in panel C are plotted. (C, D) Data (mean ± SEM) from one experiment is shown. (E) Three groups of 6- to 7-days old NB mice were infected with 1 × 106 PyNL parasites. NB mice were weaned at day 21 post birth (black arrow) and were fed with PABA-containing (PABA (+)), PABA-deficient (PABA (-)) or NCD. Parasitemia levels were evaluated by blood smears on indicated time points until clearance. (F) AUC of parasitemia burden between days 3 to 38 post infection shown in panel E are plotted. (E, F) Cumulative data (mean ± SEM) from two experiments containing 19, 17, 14 and 12 mice in PABA (+), PABA (−), NCD, and adult mice groups, respectively, are shown. Student’s t-test was used to compare the AUC between groups. *p < 0.05, **p < 0.01, and *** p < 0.001. (G) The survival of mice in panel E was assessed until 40 days after infection. Results are expressed as survival curves analyzed using the Log-rank (Mantel Cox) test for 12 PABA (+), for 10 PABA (−) and for 10 NCD mice. ****p < 0.0001 indicates comparison of survival between PABA ( +) group and the mice in the other groups (PABA (-), NB NCD and Adult mice).
Figure 3
Figure 3
NB mice Tfh, GC B cell and plasma cell development coincides with the switch to NCD after weaning. Six to 7-days old NB and 8 to 12-weeks old adult C57BL/6 mice were infected (i.p.) with 1 × 106 PyNL parasites. (A) Splenocytes of adult mice were analyzed in flow cytometry on days 0, 10 and 20 after parasite challenge (days post infection, dpi). (B) Splenocytes of NB mice were analyzed 0, 10 and 20 days after parasite challenge at 7 days after birth. NB mice remained on breast feeding until 21 days of age when they were switched to NCD. (CE) Representative dot plots depict the percentage of splenic PD-1+CXCR5+ (Tfh) cells on CD4+ pre-gated T cells (C), GL-7+FAS+ (GC B cells) on B220+ pre-gated B cells (D) and B220lowCD138+ (plasma cells) on pre-gated live cells (E) at indicated days post infection. Formation and resolution kinetics of Tfh cells, GC B Cells, and plasma cells were plotted as mean percentage of cells. Results are expressed as mean ± SEM (n = 4); *p < 0.05, and ***p < 0.001 indicate adult vs NB mice; ###p < 0.001 indicates 0 dpi vs 10 dpi in both adult and NB mice, and §§§p < 0.001 indicates 10 dpi vs 20 dpi in both adult and NB mice. (F) Splenocytes of NB mice were analyzed 0 and 15 days after PyNL challenge at 7 days after birth. NB mice remained on breast feeding until 21 days of age when they were switched to NCD. (GI) Representative dot plots depict the percentage and cell number of splenic PD-1+CXCR5+ (Tfh) cells on CD4+ pre-gated T cells (G), GL-7+FAS+ (GC B cells) on B220+ pre-gated B cells (H) and B220lowCD138+ (plasma cells) on pre-gated live cells (I) at indicated days post infection. Formation and resolution kinetics of Tfh cells, GC B Cells, and plasma cells were plotted as mean percentage and cell numbers of cells. Results are expressed as mean ± SEM (n = 4); *p < 0.05 indicate naive vs infected. One out of two experiments with similar results is shown.
Figure 4
Figure 4
Mice fed with PABA negative diet develop Tfh cells, GC B cells and plasma cells despite experiencing low parasitemia. (A) Groups of 6- to 7-days old NB mice were infected (i.p.) with 1 × 106 PyNL parasites and splenic Tfh cells, GC B cells and plasma cells were analyzed at 20 dpi. NB mice remained on breast feeding until 21 days of age when they were switched to PABA-containing or PABA-deficient diet. Mice in both groups were sacrificed at 20 dpi and splenocytes were analyzed in flow cytometry. Representative dot plots depicting the percentage and cell numbers of splenic PD-1+CXCR5+ (Tfh) cell on CD4+ pre-gated T cells (B), GL-7+FAS+ (GC B cells) on B220 pre-gated B cells (C) and B220lowCD138+on pre-gated live cells (D) and the accompanying mean percentages and cell numbers were plotted. One out of two experiments with similar results is shown. Results are expressed as mean ± SEM (n = 5); *p < 0.05 indicates PABA + vs PABA- diet fed mice.
Figure 5
Figure 5
P. yoelii infected weanlings fed with PABA-deficient diet mount anti-Plasmodium antibodies and are protected from a second PyNL-challenge. (A) Three P. yoelii infected NB mice from each of the groups that were fed with NCD and PABA (-) diet after weaning in Fig. 2E were euthanized two months after the clearance of parasitemia and serum anti-rMSP-1 antibody levels were measured in ELISA. (B) The remaining 5 NB mice from each of the groups that were fed with NCD and PABA (-) diet after weaning in Fig. 2E were challenged 2 months after the clearance of parasitemia with 1 × 106 PyNL parasites a second time and parasitemia levels were assessed by blood smear on indicated time points. As a control, 5 malaria naïve adult mice were also challenge with 1 × 106 PyNL parasites. Results are expressed as mean % parasitemia ± SEM. C) AUC of parasitemia burden between days 5 to 18 post infection shown in panel B are plotted as mean AUC ± SEM. Student’s t-test was used to compare the AUC between groups. **p < 0.01. Experiment was performed once.
Figure 6
Figure 6
Removal of PABA from the diet of P. yoelii infected weanlings sharply reduces parasitemia. Five groups of 6- to 7-days old NB mice, each containing 7 mice, were infected with 1 × 106 PyNL parasites. All mice were transferred to NCD after weaning at day 21 post birth. Subsequently, groups of mice were switched to PABA-deficient diet at 3 (A), 6 (C), 10 (E) and 14 (G) days post weaning. One group stayed on NCD. Parasitemia levels were assessed by blood smears on indicated time points until clearance. Results are expressed as mean % parasitemia ± SEM for 7 mice per group. (B, D, F, and H) AUC of parasitemia burden between days 0 to 25 post infection shown in panels A, C, E and G are plotted as mean AUC ± SEM in panels B, D, F and H, respectively. Student’s t-test was used to compare the AUC between groups. **p < 0.01, ***p < 0.001. Experiment was performed once.

References

    1. WHO. World Malaria Report 2018. http://www.who.int/malaria/publications/world_malaria_report_2018/report.... (2018).
    1. Perkins DJ, et al. Severe malarial anemia: Innate immunity and pathogenesis. Int. J. Biol. Sci. 2011;7:1427–1442. doi: 10.7150/ijbs.7.1427. - DOI - PMC - PubMed
    1. D'Alessandro U, et al. Malaria in infants aged less than six months: Is it an area of unmet medical need? Malar. J. 2012;11:400. doi: 10.1186/1475-2875-11-400. - DOI - PMC - PubMed
    1. Mwaniki MK, et al. Congenital and neonatal malaria in a rural Kenyan district hospital: An eight-year analysis. Malar. J. 2010;9:313. doi: 10.1186/1475-2875-9-313. - DOI - PMC - PubMed
    1. Foll CV. Application of malariometric data obtained from longitudinal studies on infants in northern Nigeria. Bull. World Health Organ. 1968;38:255–265. - PMC - PubMed

Publication types

MeSH terms