. 2021 Jan 8;11(1):79.
doi: 10.1038/s41598-020-79465-x.

Metabolic changes and anti-tumor effects of a ketogenic diet combined with anti-angiogenic therapy in a glioblastoma mouse model

Affiliations

Metabolic changes and anti-tumor effects of a ketogenic diet combined with anti-angiogenic therapy in a glioblastoma mouse model

Masahiro Maeyama et al. Sci Rep. .

Abstract

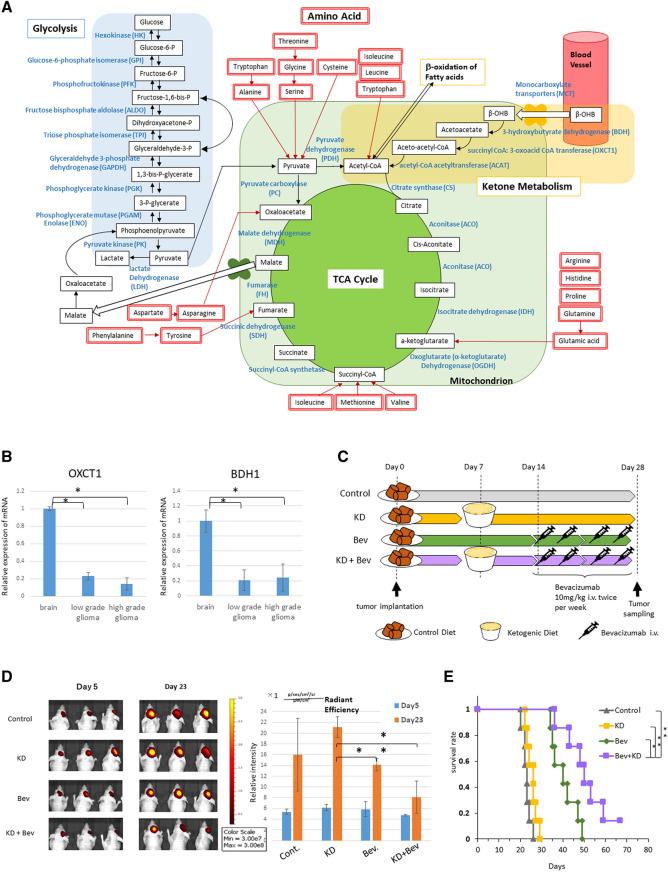
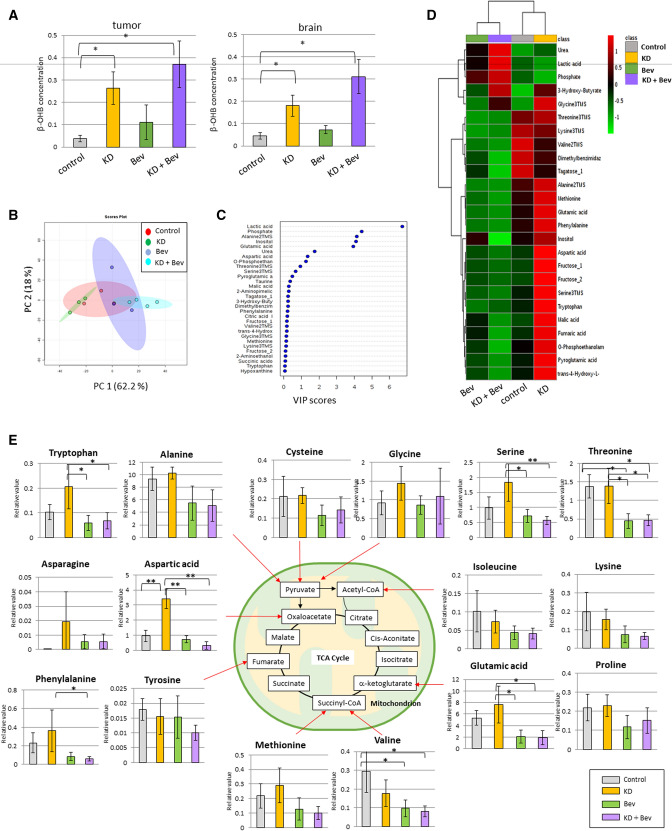
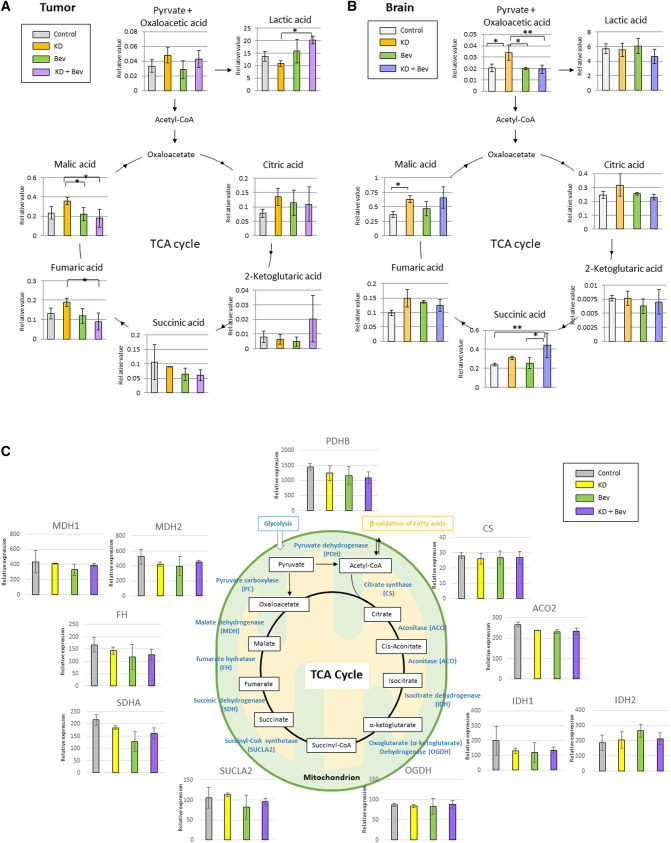
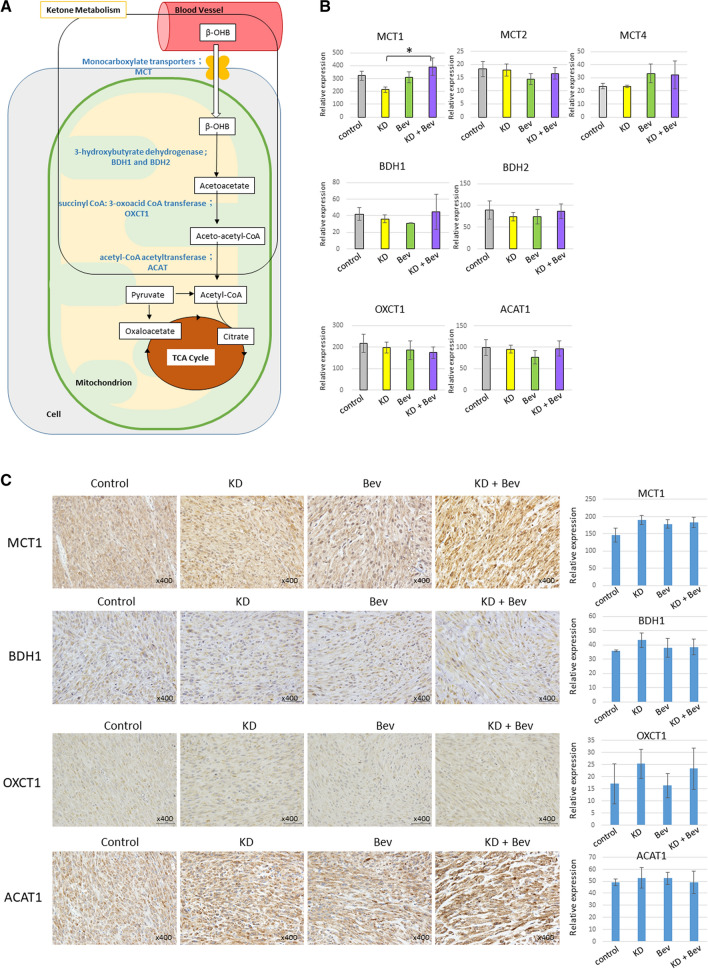
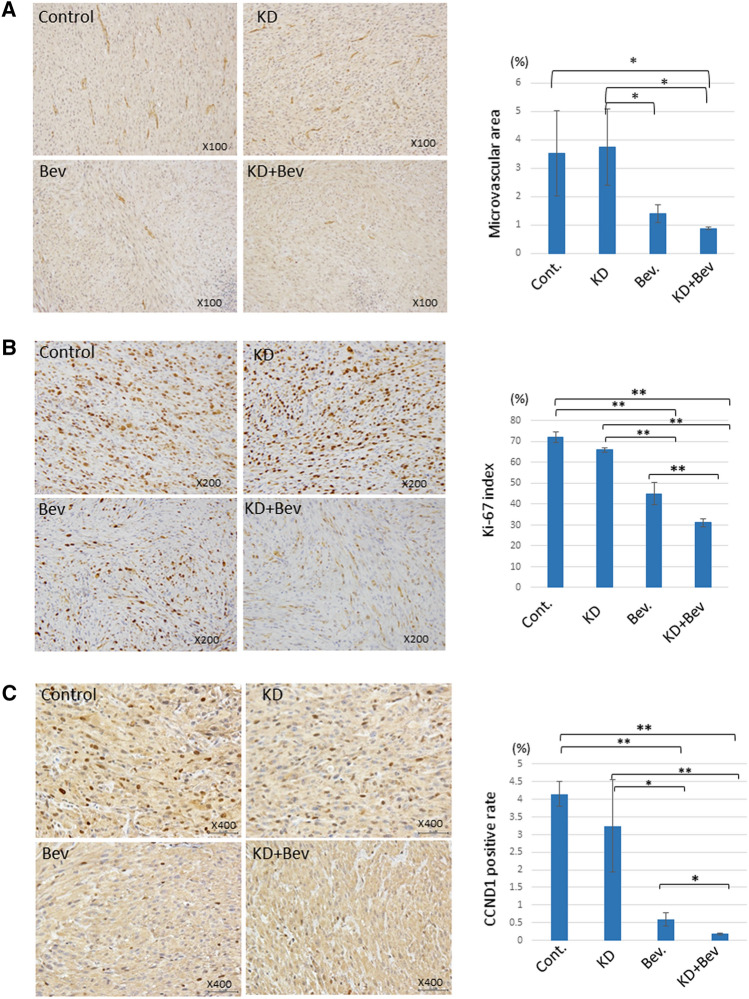
The ketogenic diet (KD) is a high fat and low carbohydrate diet that produces ketone bodies through imitation of starvation. The combination of KD and Bevacizumab (Bev), a VEGF inhibitor, is considered to further reduce the supply of glucose to the tumor. The metabolite changes in U87 glioblastoma mouse models treated with KD and/or Bev were examined using gas chromatography-mass spectrometry. The combination therapy of KD and Bev showed a decrease in the rate of tumor growth and an increase in the survival time of mice, although KD alone did not have survival benefit. In the metabolome analysis, the pattern of changes for most amino acids are similar between tumor and brain tissues, however, some amino acids such as aspartic acid and glutamic acid were different between tumors and brain tissues. The KD enhanced the anti-tumor efficacy of Bev in a glioblastoma intracranial implantation mouse model, based on lowest levels of microvascular density (CD31) and cellular proliferation markers (Ki-67 and CCND1) in KD + Bev tumors compared to the other groups. These results suggested that KD combined with Bev may be a useful treatment strategy for patients with GBM.


Conflict of interest statement

Takashi Sasayama has received fees for lectures from Chugai Pharmaceutical Co., Ltd. Other authors have no potential conflicts of interest to disclose.

Figures

Figure 1
Figure 1
(A) Metabolic pathway of glucose, ketone body, and amino acid. (B) Comparison of mRNA expression levels of ketone metabolizing enzymes (OXCT1 and BDH1) in peripheral normal brain (n = 2), low grade gliomas (n = 4) and high grade gliomas (n = 12) (*p < 0.05, **p < 0.01). (C) Treatment schedule for mice. The ketogenic diet is started 7 days after transplantation, and bevacizumab treatment is started 14 days after transplantation. Bevacizumab is administered at a dose of 10 mg/kg intravenously via the tail vein. The implanted mice are divided into 4 groups: standard diet (control), ketogenic diet alone (KD), bevacizumab alone (Bev), and ketogenic diet plus bevacizumab (KD + Bev). Five mice/group in metabolome analysis, 5 mice/group in microarray analysis, 7 mice/group in survival analysis, and 3 mice/group in in vivo image analysis were examined. One month later, the mice are sacrificed and tumors are collected, and metabolome analysis, histological analysis, and microarray analysis are conducted. (D) Comparison of the tumor growth in each treatment group. U87 IVIS cells are transplanted into the mice brain and treat with a ketone diet and bevacizumab. Fluorescence is measured 6 days and 23 days after transplantation. After 23 days, the fluorescence intensity of the KD + Bev group is significantly lower than that of the KD group. (E) Comparison of the survival curves of the mice in each treatment group. The KD + Bev group has significantly longer survival than any other group (control group, KD group: **p < 0.01, Bev group: *p = 0.025).
Figure 2
Figure 2
(A) Comparison of β-OHB concentration in the tumor and normal brain in each group. In the ketogenic diet groups (KD and KD + Bev), it is markedly increased (*p < 0.05, **p < 0.01, and Tukey–Kramer test). (B) PCA analysis of the tumor tissue in each of the four groups. (C) VIP score analysis of the tumor tissue. (D) Heat map showing characteristic metabolite changes in the tumor tissue in each group. (E) Comparison of the amino acids levels in the control, KD, Bev, and KD + Bev groups. Note several amino acids increase by the KD, and most of the amino acids decrease in KD + Bev group. In particular, the change in aspartic acid is most significant (*p < 0.05, **p < 0.01, and Tukey–Kramer test).
Figure 3
Figure 3
(A) Metabolome analysis of TCA cycle-related metabolites in the tumor tissue. (*p < 0.05, **p < 0.01, and Tukey–Kramer test) (B) Metabolome analysis of TCA cycle-related metabolites in the normal brain tissue. (*p < 0.05, **p < 0.01, and Tukey–Kramer test) (C) Comparison of mRNA expression levels of TCA cycle-related enzymes. (*p < 0.05, **p < 0.01, and Tukey–Kramer test).
Figure 4
Figure 4
(A) Schema of the ketone metabolic pathway. (B) Comparison of mRNA expression levels of ketone metabolizing enzymes or ketone body transport proteins. (*p < 0.05, **p < 0.01, and Tukey–Kramer test). (C) Immunostaining of ketone metabolizing enzymes (OXCT1, BDH1, and ACAT1) and ketone body transport protein (MCT1). Immunostaining analyses analyze 5 tumors in each group. An intensity of immunostainings is quantified using image J software.
Figure 5
Figure 5
(A) Comparison of the vascular density in the tumor tissue in each treatment group. Tumor tissue is immunostained with CD31 to quantify the vascular area. Immunostaining analyses analyze 5 tumors in each group. In the KD + Bev group, the blood vessel density is significantly lower than in the control and KD groups. (*p < 0.05, **p < 0.01, and Tukey–Kramer test) (B) Comparison of Ki-67 immunostaining and Ki-67 index of the tumor tissue in each treatment group. Immunostaining analyses analyze 5 tumors in each group. The Ki-67 index is significantly lower in the KD + Bev group than in any other group. (*p < 0.05, **p < 0.01, and Tukey–Kramer test) (C) Comparison of tumor tissue by cyclin D1 immunostaining. Immunostaining analyses analyze 5 tumors in each group. In the control and KD group, cyclin D1 is markedly accumulated in the nucleus, but in the KD + Bev group, the accumulation in the nucleus is significantly reduced. (*p < 0.05, **p < 0.01, and Tukey–Kramer test).

References

    1. Chinot OL, et al. Bevacizumab plus radiotherapy-temozolomide for newly diagnosed glioblastoma. N. Engl. J. Med. 2014;370:709–722. doi: 10.1056/NEJMoa1308345. - DOI - PubMed
    1. Stupp R, et al. Maintenance therapy with tumor-treating fields plus temozolomide vs temozolomide alone for glioblastoma: A randomized clinical trial. JAMA. 2015;314:2535–2543. doi: 10.1001/jama.2015.16669. - DOI - PubMed
    1. Muragaki Y, et al. Phase II clinical study on intraoperative photodynamic therapy with talaporfin sodium and semiconductor laser in patients with malignant brain tumors. J. Neurosurg. 2013;119:845–852. doi: 10.3171/2013.7.JNS13415. - DOI - PubMed
    1. Vander Heiden MG, Cantley LC, Thompson CB. Understanding the Warburg effect: The metabolic requirements of cell proliferation. Science. 2009;324:1029–1033. doi: 10.1126/science.1160809. - DOI - PMC - PubMed
    1. Warburg O. On respiratory impairment in cancer cells. Science. 1956;124:269–270. - PubMed

Publication types

LinkOut - more resources