. 2021 Jan 8;11(1):62.
doi: 10.1038/s41598-020-79660-w.

Honeybee colonies compensate for pesticide-induced effects on royal jelly composition and brood survival with increased brood production

Affiliations

Honeybee colonies compensate for pesticide-induced effects on royal jelly composition and brood survival with increased brood production

Matthias Schott et al. Sci Rep. .

Abstract

Sublethal doses of pesticides affect individual honeybees, but colony-level effects are less well understood and it is unclear how the two levels integrate. We studied the effect of the neonicotinoid pesticide clothianidin at field realistic concentrations on small colonies. We found that exposure to clothianidin affected worker jelly production of individual workers and created a strong dose-dependent increase in mortality of individual larvae, but strikingly the population size of capped brood remained stable. Thus, hives exhibited short-term resilience. Using a demographic matrix model, we found that the basis of resilience in dosed colonies was a substantive increase in brood initiation rate to compensate for increased brood mortality. However, computer simulation of full size colonies revealed that the increase in brood initiation led to severe reductions in colony reproduction (swarming) and long-term survival. This experiment reveals social regulatory mechanisms on colony-level that enable honeybees to partly compensate for effects on individual level.


Conflict of interest statement

The authors declare no competing interests.

Figures

Figure 1
Figure 1
Hypopharyngeal gland size in age-defined worker bees. Age-defined worker bees, which were placed in the colonies and recovered in week 2 (12 days after hatching), were analyzed for the acini size of the HPG. (A) HPG of a control worker bee. (B) HPG of a worker bee from a colony exposed to 100 µg/L clothianidin (bar = 100 µm). (C) Clothianidin exposure reduced the acinus diameter of HPGs. Control individuals had larger acini than workers exposed to clothianidin (control, n = 31; 1 µg/L, n = 22; 10 µg/L, n = 22; 100 µg/L, n = 23). Mixed-effects ANOVA, (P = 0.0120; post hoc Dunnett contrasts, control vs. 1 µg/L, P < 0.001; control vs. 10 µg/L, P = 0.0345; control vesus 100 µg/L, P = 0.0027). Raw data and technical details of the analysis are presented in the supplementary statistical report, “Hypopharyngeal gland size” section.
Figure 2
Figure 2
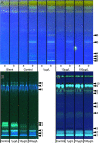
Lipid profiles of worker jelly samples (A) and larvae (B, C) from week 3. Samples of worker jelly (A) were taken using absorptive filter strips (Sugi strips), extracted with n-hexane and separated by HPTLC. Each Sugi strip was halved: one half without the sample (track a) and the other with absorbed sample (track b). A fresh Sugi strip from the same batch as the strips used in the experiment cut in two equal halves served as the blank. The lanes are labeled to show the dose of clothianidin treatments (control = no clothianidin). The analysis of larvae is shown before (B) and after derivatisation (C). For worker jelly, the declining quantity of substances was observed for the lipid profiling (UV 366 nm after derivatization). The latter also was evident for the larvae. Numbers on the right side indicate differences, see SFig 3B, F and H.
Figure 3
Figure 3
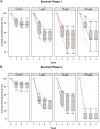
Survival of individually tracked larvae. Individually marked brood cells were tracked from the first larval stage (day 4–5 after egg laying) to emergence. (A) The percentage of brood surviving from week 1 to week 4 (survival phase A). Colonies exposed to clothianidin showed a reduced brood survival. Clothianidin exposure significantly affects brood survival (exposure-by-time interaction in mixed-effects ANOVA, P = 0.0293). One-sided tests for post hoc Dunnett contrasts yielded no significant P values in week 2, but in week 3 all clothianidin treatments showed significant differences (control vs. 1 µg/L, P = 0.0414; control vs. 10 µg/L, P = 0.0241; control vs. 100 µg/L, P = 0.0418). (B) The percentage of brood surviving from week 4 to week 7 (survival phase B). Clothianidin exposure reduced the number of surviving brood (exposure-by-time interaction in mixed effects ANOVA, P = 0.03776). One-sided tests for post hoc Dunnett contrasts in weeks 5 and 6: each clothianidin treatment has a significantly lower brood survival than the control group (P < 0.0001 in all cases). Technical details of the analysis are provided in the supplementary statistical report, “Brood survival” section.
Figure 4
Figure 4
Brood quantification. Every week, the mean number of eggs (red), larvae (blue), and pupae (green) was determined for every colony over a period of 7 weeks. The black dashed line depicts the mean values of the control. In colonies exposed to lower or medium concentrations of clothianidin, the mean number of eggs, larvae or capped brood were similar or tended to exceed the numbers of the control group. The trends for the eggs, larvae, and capped brood cells all differed significantly between the treatment groups (main effects of quadratic time and their interaction with treatment in linear mixed-effects models, P < 0.001 in all cases). Pairwise comparisons showed that the temporal profiles of eggs differed significantly from the control for all clothianidin doses (P < 0.03 in all cases), and that for larvae and capped brood cells only the 100 µg/L group differed significantly from the control. Weeks 6 and 7 were already in September, thus a seasonally related drop in brood nest size was observed at the end of the experiment. Raw data and technical details of the analysis are provided in the supplementary statistical report, “HPTLC analysis of worker jelly and larvae” section.
Figure 5
Figure 5
Ratio between developmental stages. (A) The ratio of the number of larvae/eggs. The eggs in week 2 become the larvae of week 3, so the number of larvae is shifted by 1 week. The ratio of controls is stable throughout the experiment (mean = 1.5) until week 7, where a seasonally related drop in brood activity was observed. (B) The ratio of capped brood/larvae (number of capped brood shifted by 1 week) was stable in the controls (mean = 2.06), and the 1 µg/L (mean = 1.92) and 10 µg/L (mean = 1.7) groups, but dropped in the 100 µ/L treatment group in weeks 4 and 6 (mean = 1.44).
Figure 6
Figure 6
Colony sizes decline with increasing concentrations of clothianidin in simulated full-sized colonies. To estimate the potential impact of clothianidin exposure on standard-sized colonies, a BEEHAVE simulation was conducted under default settings but with less protein in the jelly (ProteinFactorNurses) as defined by ProteinNursesModifier_Exposed, with values set according to the results of the previous set of simulations (Table 2). Colony sizes (mean number of worker bees) at the end of the year decreased with increasing concentrations of clothianidin, particularly when swarming was prevented (dark grey). When swarming was allowed (light grey), the control group produced 1.2 swarms in the first year. For the 1 and 10 µg/L treatment groups, each colony released a single swarm during the first year. No swarms at all were produced in the 100 µg/L group.

Similar articles

Cited by

References

    1. Bascompte-Jordi PJ, Olesen JM. Asymmetric coevolutionary networks facilitate biodiversity maintenance. Science. 2006;312:431–443. doi: 10.1126/science.1123412. - DOI - PubMed
    1. Klein A-M, Vaissière BE, Cane JH, Steffan-Dewenter I, Cunningham SA, Kremen C, Tscharntke T. Importance of pollinators in changing landscapes for world crops. Proc. R. Soc. B. 2007;274:303–313. doi: 10.1098/rspb.2006.3721. - DOI - PMC - PubMed
    1. Council NR. Status of Pollinators in North America. Washington: The National Academies Press; 2007.
    1. vanEngelsdorp D, Hayes J, Jr, Underwood RM, Pettis JA. A Survey of Honey Bee Colony Losses in the U.S., Fall 2007 to Spring 2008. PLoS ONE. 2009;3:e4071. doi: 10.1371/journal.pone.0004071. - DOI - PMC - PubMed
    1. Goulson D, Nicholls E, Botias C, Rotheray EL. Bee declines driven by combined stress from parasites, pesticides, and lack of flowers. Science. 2015;347:1255957. doi: 10.1126/science.1255957. - DOI - PubMed

Publication types