. 2021 Jan 8;11(1):196.
doi: 10.1038/s41598-020-80013-w.

Synergistic antibacterial activity of surfactant free Ag-GO nanocomposites

Affiliations

Synergistic antibacterial activity of surfactant free Ag-GO nanocomposites

Muhammad Ashfaq Ahmad et al. Sci Rep. .

Abstract

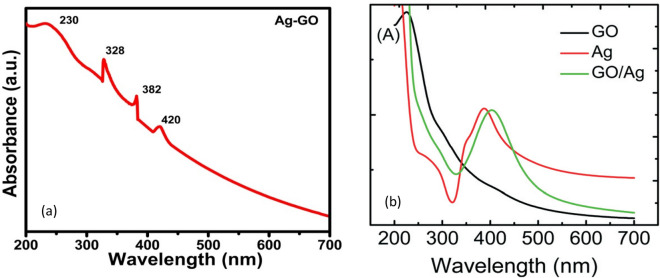
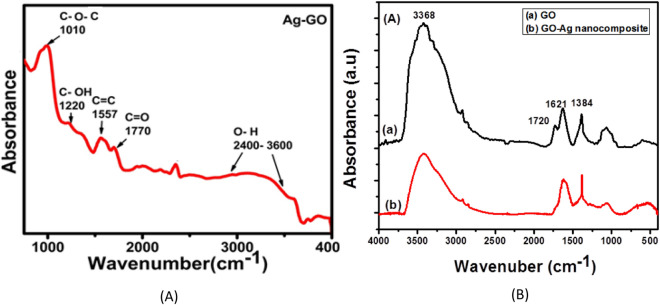
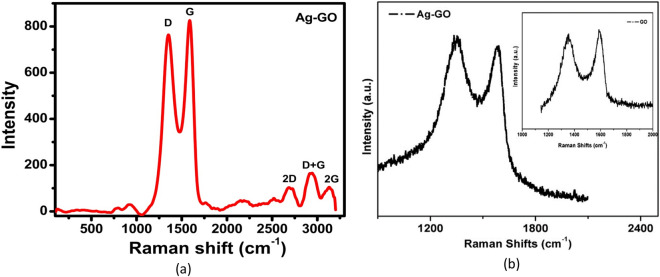
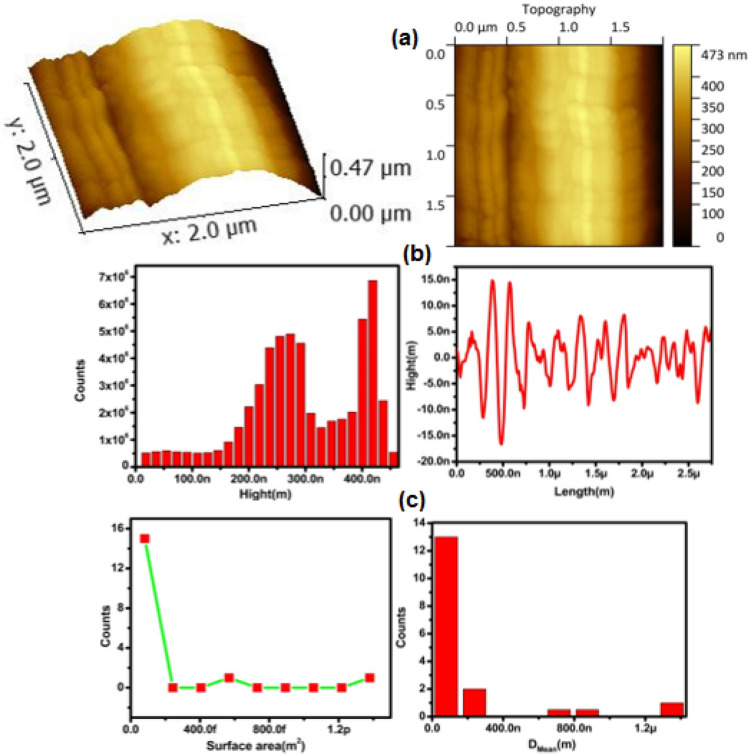
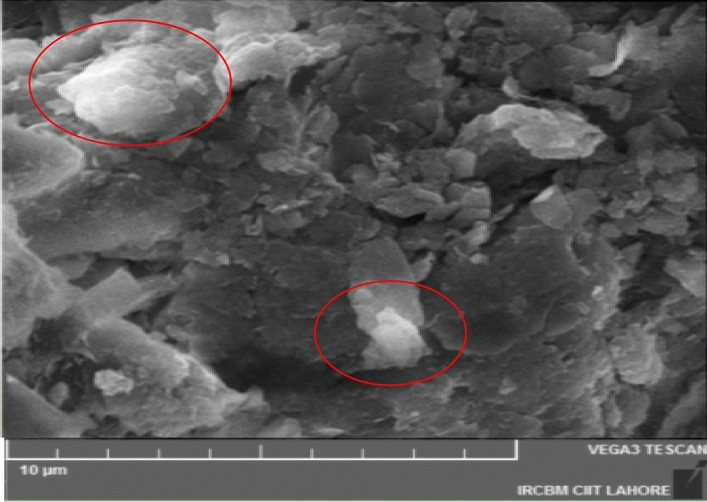
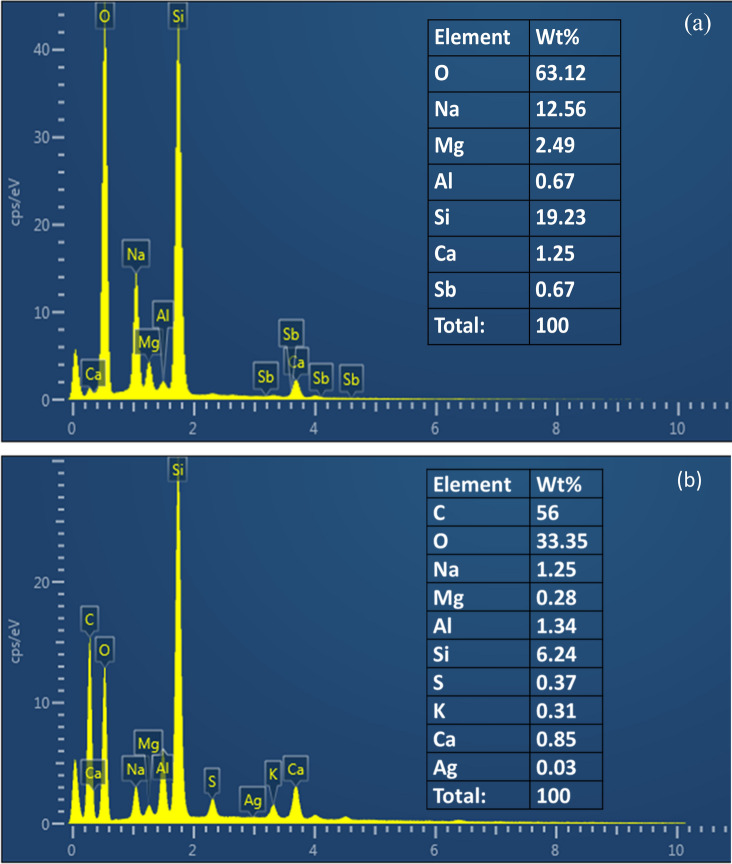
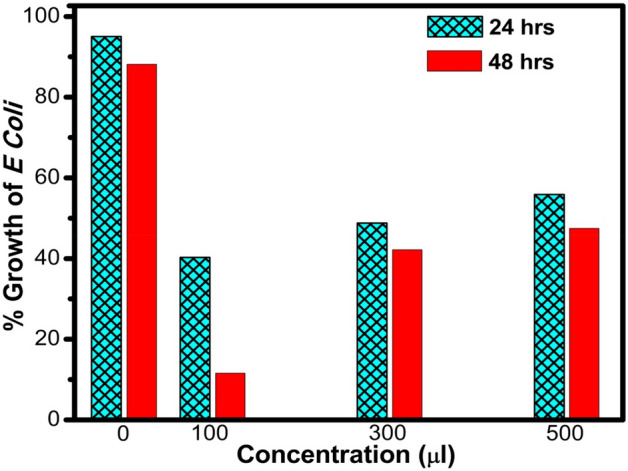
Graphene oxide-silver (Ag-GO) nanocomposite has emerged as a vital antibacterial agent very recently. In this work, we report a facile one step route of Ag-GO nanocomposite formation excluding the aid of surfactants and reductants and was successfully applied to negative Escherichia Coli (E coli) to investigate antibacterial activity by varying doze concentration. The successful formation of Ag-GO nanocomposite via facile one step route was confirmed using Fourier transform infrared spectroscopy (FTIR) and Raman Spectroscopy. The absorption spectra (peak ~ 300 nm) for GO and the (peak ~ 420 nm) for silver nanoparticles were observed. XRD study confirmed the formation of Ag-GO nanocomposite while atomic force microscopy (AFM) showed crumbled GO sheets decorated with Ag nanoparticles. It was observed that the functional groups of GO facilitated the binding of Ag nanoparticles to GO network and enhanced the antibacterial activity of the nanocomposite.


Conflict of interest statement

The authors declare no competing interests.

Figures

Figure 1
Figure 1
(a) UV–Vis spectra of Ag–GO sample (b) UV–Vis spectra of GO and Ag–GO reported in Ref..
Figure 2
Figure 2
(A) FTIR spectrum of Ag–GO sample (B) FTIR spectra of GO and Ag–GO reported in Ref..
Figure 3
Figure 3
XRD pattern of Ag–GO sample.
Figure 4
Figure 4
(a) Raman spectrum of Ag–GO sample (b) Raman spectra of GO and Ag–GO nanocomposite reported in reference.
Figure 5
Figure 5
AFM topography images (a), Height distribution and height profile (b), surface area and particle size distribution (c) of Ag–GO sample.
Figure 6
Figure 6
SEM micrograph of Ag–GO nanocomposite.
Figure 7
Figure 7
SEM micrograph of Ag–GO nanocomposite.
Figure 8
Figure 8
Percentage growth of E. coli treated with different concentrations of Ag–GO nanocomposite.

Similar articles

Cited by

References

    1. Oscar N, Fernando R, Baojiang KAS, Nicholas W, Pengju AB, Nicholas GL, Marlin DM, Ya-Ping V, Christopher EB. Graphene oxide: A nonspecific enhancer of cellular growth. ACS Nano. 2011;5(10):8100–8107. doi: 10.1021/nn202699t. - DOI - PubMed
    1. Pasricha R, Gupta S, Srivastava AK. A facile and novel synthesis of Ag–graphene-based nanocomposite. Small. 2009;5(20):2253–2259. doi: 10.1002/smll.200900726. - DOI - PubMed
    1. Chung C, Kim YK, Shin D, Ryoo SR, Hong BH, Min DH. Biomedical applications of graphene and graphene oxide. Acc. Chem. Res. 2013;46(10):2211–2224. doi: 10.1021/ar300159f. - DOI - PubMed
    1. Sims CM, Hanna SK, Heller DA, Horoszko CP, Johnson ME, Bustos ARM, Reipa V, Riley KR, Nelson BC. Redox-active nanomaterials for nanomedicine applications. Nanoscale. 2017;9:15226–15251. doi: 10.1039/C7NR05429G. - DOI - PMC - PubMed
    1. Szunerits S, Boukherroub R. Antibacterial activity of graphene based materials. J. Mater. Chem. B. 2016;4:6892–6912. doi: 10.1039/C6TB01647B. - DOI - PubMed

MeSH terms

LinkOut - more resources