. 2021 Jan 8;11(1):47.
doi: 10.1038/s41598-020-79984-7.

Aberrant aggressive behavior in a mouse model of Angelman syndrome

Affiliations

Aberrant aggressive behavior in a mouse model of Angelman syndrome

Lilach Simchi et al. Sci Rep. .

Abstract

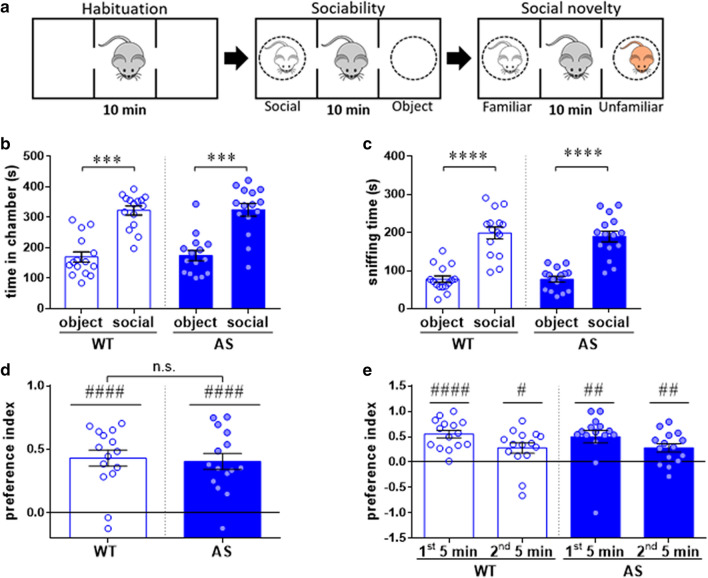
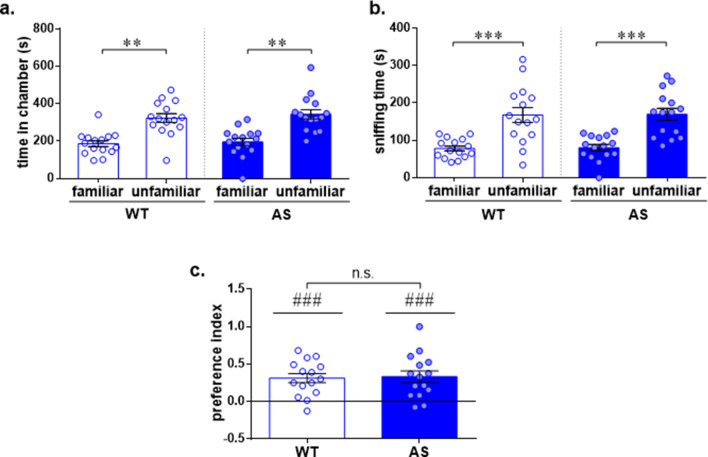
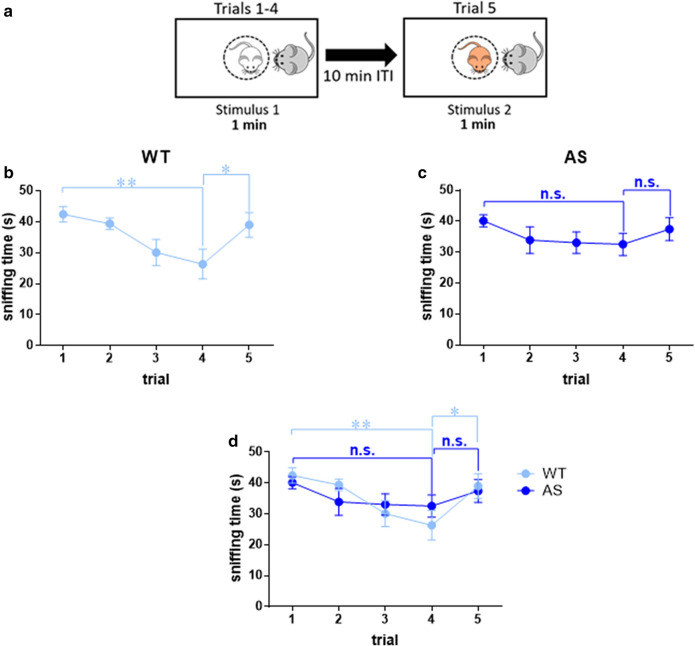
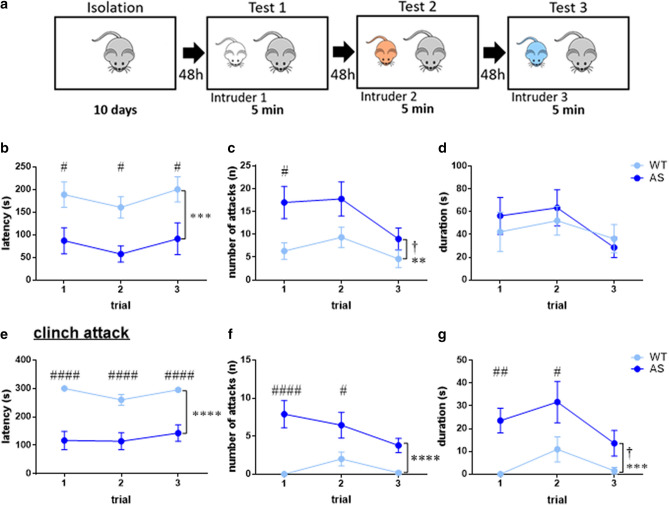
Angelman syndrome (AS) is a genetic neurodevelopmental disorder due to the absence of the E3-ligase protein, UBE3A. Inappropriate social interactions, usually hyper-sociability, is a part of that syndrome. In addition, clinical surveys and case reports describe aggressive behavior in AS individuals as a severe difficulty for caretakers. A mouse model for AS recapitulates most of the human AS phenotypes. However, very few studies utilized this mouse model for investigating affiliative social behavior, and not even a single study examined aggressive behavior. Hence, the aim of the herein study was to examine affiliative and aggressive social behavior. For that, we utilized a battery of behavioral paradigms, and performed detailed analyses of these behaviors. AS mice exhibited a unique characteristic of reduced habituation towards a social stimulus in comparison to their wild-type (WT) littermates. However, overall there were no additional marked differences in affiliative social behavior. In contrast to the mild changes in affiliative behavior, there was a striking enhanced aggression in the AS mice compared to their WT littermates. The herein findings emphasize the use of AS mouse model in characterizing and measuring inappropriate aggressive behavior, and suggests these as tools for investigating therapeutic interventions aimed at attenuating aggressive behavior.


Conflict of interest statement

The authors declare no competing interests.

Figures

Figure 1
Figure 1
AS male mice do not display aberrant sociability in the three-chamber social test. (a) Illustration of sociability and social novelty tests. (b) Time spent in the chamber containing the novel mouse (‘social’) and the chamber containing the empty wire cage (‘object’). Both genotypes exhibit enhanced exploration of the social chamber. (c) Sniffing time of the novel mouse and the empty wire cage. Both WT and AS mice spend more time sniffing the social stimulus (novel mouse). (d) Social preference index (PI) towards the social stimulus. WT and AS mice exhibit a comparable social PI. (e) Social PIs are binned into 5-min bins. Both genotypes maintained positive social PI along the entire trial. Bar graphs represent mean ± SEM. N = 15 mice per each group (WT and AS). ***p < 0.001,****p < 0.0001, n.s. = non-significant; #p < 0.05, ##p < 0.01, ####p < 0.0001 represent a difference from chance level.
Figure 2
Figure 2
AS male mice display intact social discrimination in social novelty three-chamber social test. (a) Time spent in the chamber containing the familiar mouse and the chamber containing the unfamiliar mouse. WT and AS mice spend more time in the chamber containing the unfamiliar stimulus. (b) Time spent sniffing each stimulus mouse. WT and AS demonstrated comparable enhanced sniffing of the unfamiliar stimulus mouse relative to the familiar mouse. (c) Social novelty preference index (PI). AS mice display a comparable positive social novelty PI toward the unfamiliar mouse. Bar graphs represent mean ± SEM. N = 15 per each group (WT and AS). **p < 0.01, ***p < 0.001, n.s. = non-significant; ###p < 0.001 represents a difference from chance level.
Figure 3
Figure 3
AS male mice exhibit impaired social habituation in social habituation\dishabituation test. (a) Illustration of social habituation/dishabituation test. (bd) Social exploration time in each of the five trials. (b) Sniffing time of stimulus mouse by WT mouse. WT mice show habituation to the repeatedly introduced stimulus mouse, and dishabituation towards the novel stimulus mouse. (c) Sniffing time of stimulus mouse by AS mouse. AS mice do not show habituation to the repeatedly introduced stimulus mouse, nor dishabituation to the novel stimulus mouse. (d) Concatenated graph of graphs a and b. Line graphs represent mean ± SEM. N = 12 mice per each group (WT and AS). *p < 0.05, **p < 0.01 and n.s. = non-significant represent differences between trials within groups.
Figure 4
Figure 4
AS model mice display a minor alteration in long-term social discrimination memory (SDM). (a) Illustration of long-term SDM test. (b) Time spent sniffing the familiar mouse and the unfamiliar mouse, 24 h after the exposure to the familiar mouse. WT and AS mice similarly spend more time sniffing the unfamiliar mouse than the familiar mouse. (c) Long-term SDM preference index (PI) towards the unfamiliar mouse. WT mice display positive long-term SDM PI, while AS mice do not. However, the long-term SDM PI does not differ between genotypes. (d) Long-term SDM PI during the first 5 min of the test. Both genotypes showed a positive PI during the first 5 min, yet WT mice exhibit a trend for a higher PI compared to AS littermates. Bar graphs represent mean ± SEM. N = 8 mice per each group (WT and AS). *p < 0.05, **p < 0.01; ###p < 0.001, ####p < 0.0001, n.s. = non-significant, represent differences from the chance level; ITI = inter-trial interval.
Figure 5
Figure 5
AS male mice display enhanced aggression in the resident-intruder test. (a) Illustration of the resident-intruder test. (bd) Overall aggressive behavior is enhanced in AS mice. (b) The latency to the first attack. (c) Number of attacks during 5 min. (d) Total accumulative duration of attacks. (ef) excessive uncontrolled aggression (clinch) is markedly predominant in AS male mice. (e) Latency to the first clinch attack. (f) Number of clinch attacks during 5 min. (g) Cumulative duration of clinch attacks. Line graphs represent mean ± SEM. N = 11 mice, N = 9 mice for WT and AS, respectively. #p < 0.05, ##p < 0.01, ####p < 0.0001 represent a genotype difference for each trial. **p < 0.01, ***p < 0.001, ****p < 0.0001 represent an accumulative genotype effect. p < 0.05 represents a  trial effect.

Similar articles

Cited by

References

    1. Jiang Y, Lev-Lehman E, Bressler J, Tsai T-F, Beaudet AL. Genetics of Angelman syndrome. Am. J. Hum. Genet. 1999;65:1–6. doi: 10.1086/302473. - DOI - PMC - PubMed
    1. Angelman H. ‘Puppet’children a report on three cases. Dev. Med. Child Neurol. 1965;7:681–688. doi: 10.1111/j.1469-8749.1965.tb07844.x. - DOI - PubMed
    1. Williams CA, et al. Angelman syndrome 2005: updated consensus for diagnostic criteria. Am. J. Med. Genet. Part A. 2006;140:413–418. doi: 10.1002/ajmg.a.31074. - DOI - PubMed
    1. Matsuura T, et al. De novo truncating mutations in E6-Ap ubiquitin-protein ligase gene (UBE3A) in Angelman syndrome. Nat. Genet. 1997;15:74–77. doi: 10.1038/ng0197-74. - DOI - PubMed
    1. Kishino T, Lalande M, Wagstaff J. UBE3A/E6-AP mutations cause Angelman syndrome. Nat. Genet. 1997;15:70–73. doi: 10.1038/ng0197-70. - DOI - PubMed

Publication types

LinkOut - more resources