. 2021 Jan 8;11(1):42.
doi: 10.1038/s41598-020-79779-w.

Anti-tumour activity of deer growing antlers and its potential applications in the treatment of malignant gliomas

Affiliations

Anti-tumour activity of deer growing antlers and its potential applications in the treatment of malignant gliomas

Louis Chonco et al. Sci Rep. .

Abstract

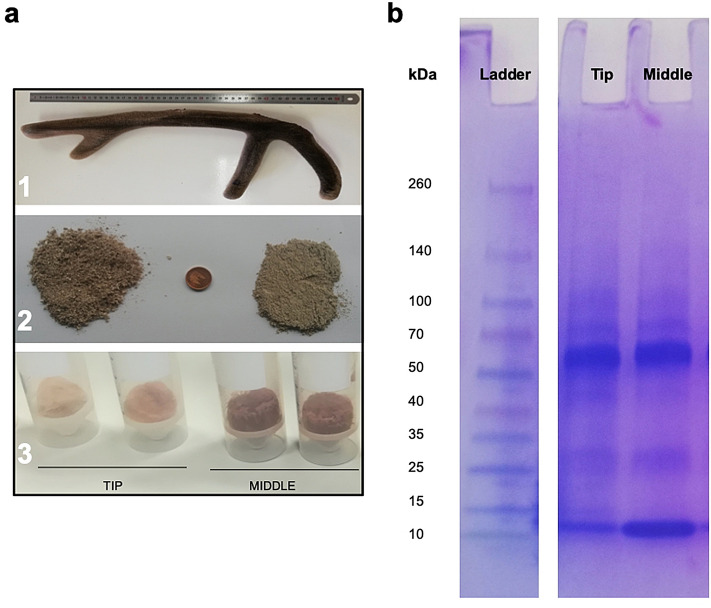
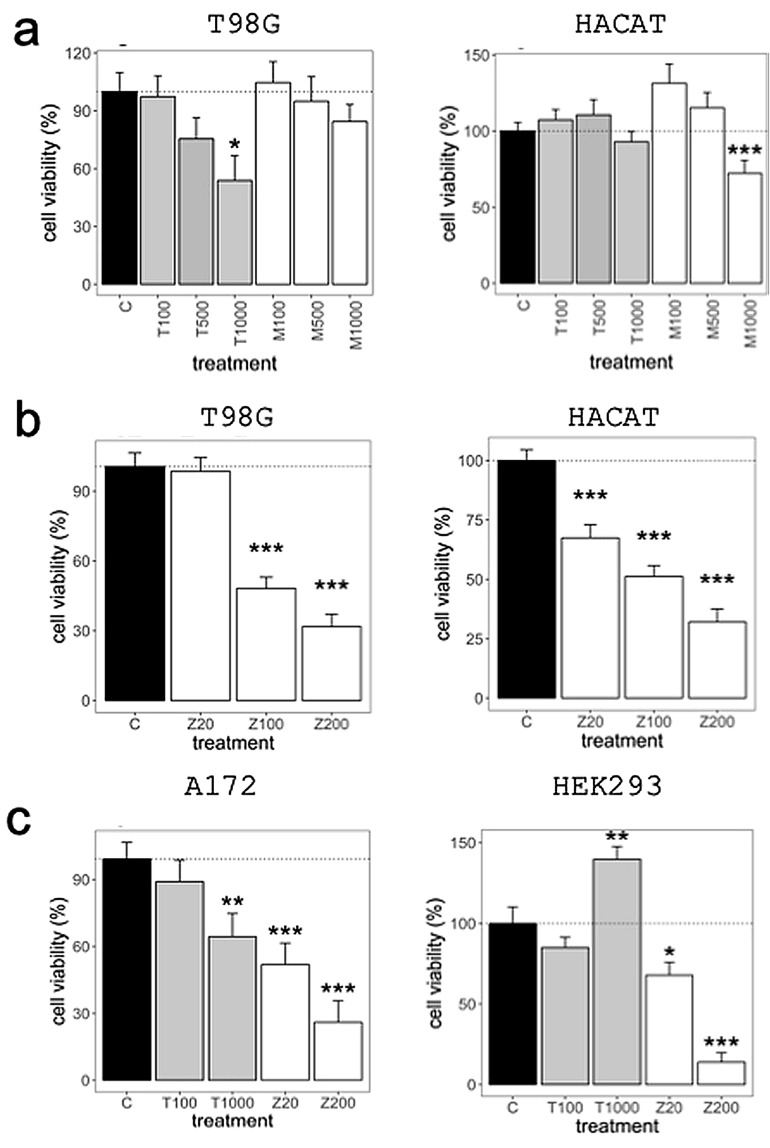
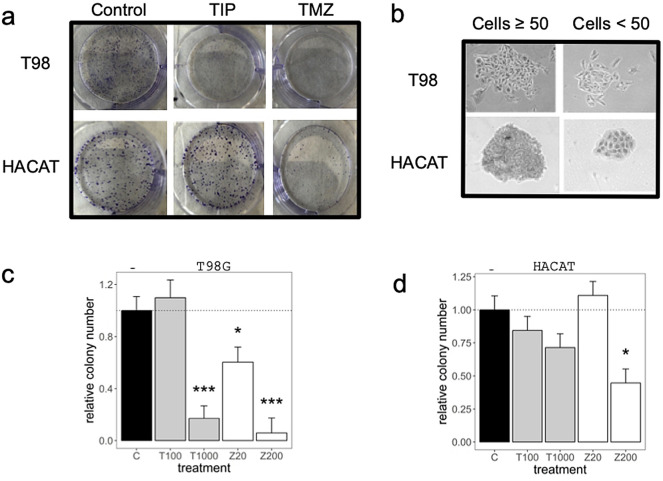
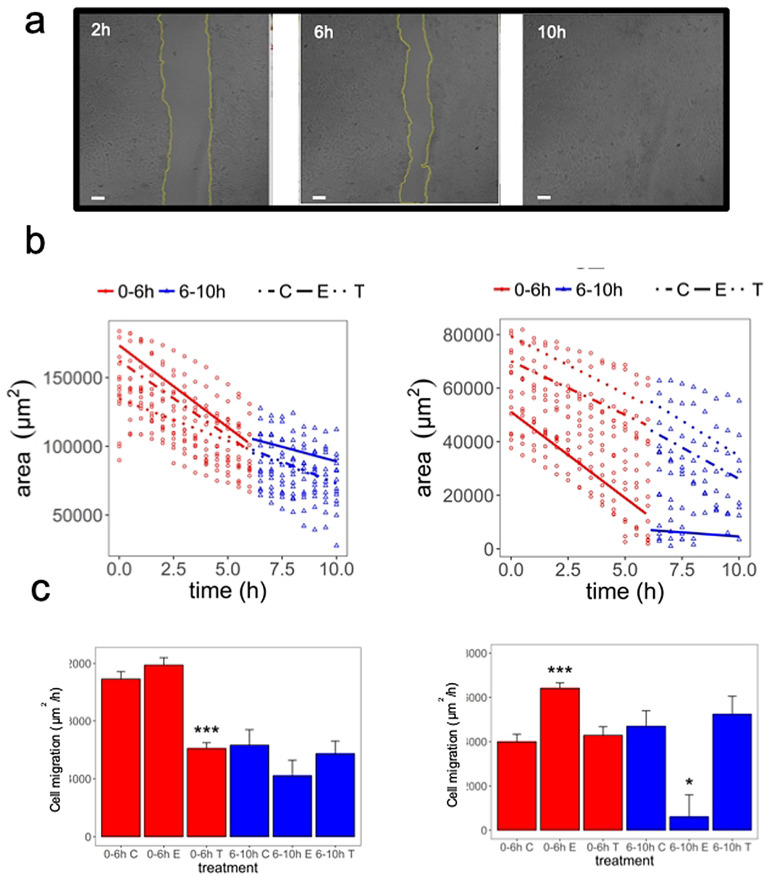
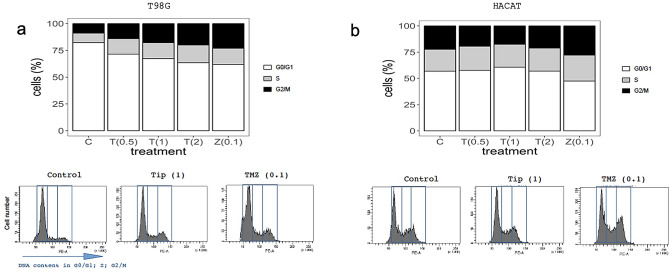
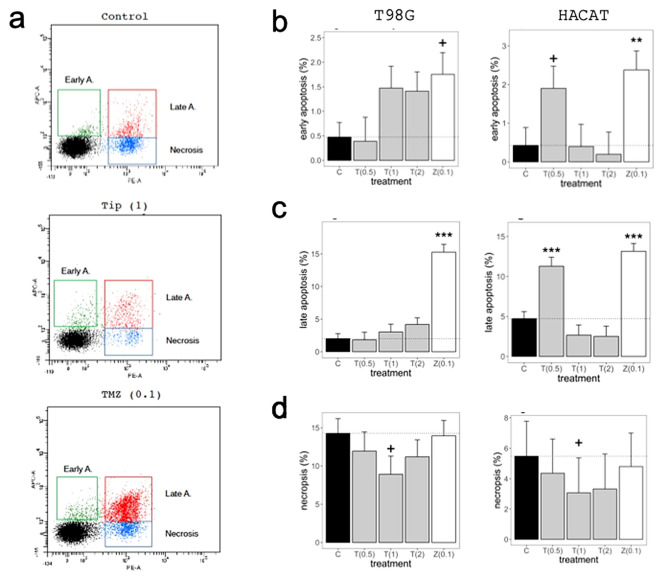
A recent study showed that antlers have evolved a high rate of growth due to the expression of proto-oncogenes and that they have also evolved to express several tumour suppressor genes to control the risk of cancer. This may explain why deer antler velvet (DAV) extract shows anti-tumour activity. The fast growth of antler innervation through the velvet in close association to blood vessels provides a unique environment to study the fast but non-cancerous proliferation of heterogeneous cell populations. We set out to study the anti-cancer effect of DAV in glioblastoma (GB) cell lines in comparison with temozolomide, a chemotherapeutic drug used to treat high-grade brain tumours. Here we report, for the first time, that DAV extract from the tip, but not from mid-parts of the antler, exhibits an anti-tumour effect in GB cell lines (T98G and A172) while being non-toxic in non-cancerous cell lines (HEK293 and HACAT). In T98G cells, DAV treatment showed reduced proliferation (37.5%) and colony-formation capacity (84%), inhibited migration (39%), induced changes in cell cycle progression, and promoted apoptosis. The anticancer activity of DAV extract as demonstrated by these results may provide a new therapeutic strategy for GB treatment.


Conflict of interest statement

The authors declare no competing interests.

Figures

Figure 1
Figure 1
Deer antler velvet (DAV) extract. (a) 1. Example of a red deer antler of 2 years old in the optimum phase of growth to be used for the extraction of bioactive products; 2. Tip (2.5 cm) and middle sections (5 cm each) are milled (left) and pulverized (right) to obtain a DAV powder; 3. DAV extract from the tip and middle sections after the freeze-dried process. (b) Proteins analyzed by SDS-PAGE on a 4–15% precast polyacrylamide gel (cropped gel. Full-length gel is included in Supplementary Information).
Figure 2
Figure 2
Cell viability assay. (a) Cytotoxicity in T98G cell line (left) and HACAT non-cancerous cell line (right) following 72 h treatment with Tip and Middle extracts from the same DAV. (b) Dose-dependent representation for T98G (left) and HACAT (right) cell lines following 72 h treatment with TMZ. (c) Cytotoxicity in A172 (left) and HEK293 (right) cell lines following 72 h treatment with DAV extract and TMZ. Values are shown in μg/mL. T tip portion, M middle portion, Z TMZ. Linear mixed models to assess the effects of treatments were used. Data are means ± standard error of the mean (SEM) (n = 3). P-value of the significant pairwise comparison against control (+P = 0.1–0.05, *P = 0.05–0.01, **P = 0.01–0.001, ***P ≤ 0.001).
Figure 3
Figure 3
Tumor clonogenic assay (TCA). (a) TCA was performed in a 6-well plate, with clones produced by T98G and HACAT cells at day 12 following treatment with DAV and TMZ at 1 mg/mL and 0.2 mg/mL, respectively. (b) The number of colonies containing ≥ 50 cells was counted under a microscope. (c,d) Relative colony number was represented for T98G and HACAT cells, respectively. Values are shown in μg/mL. Linear mixed models to assess the effects of treatments were used as described in Fig. 1. Data are means ± SEM (n = 2).
Figure 4
Figure 4
Scratch assay. (a) HACAT cell images from a wound-healing experiment at different time points. As an example, EGF treated cells at 10 ng/mL are shown at 2, 6, and 10 h. Scale bar = 100 μm. (b) T98G and HACAT cell images in a time series were analyzed for gap area over time. Linear mixed regression to model the rates of wound healing across time is shown. (c) The cell migration rate for T98G and HACAT cells is shown. Values in brackets stand for compound concentration in mg/mL. C control, T tip portion, E EGF. Data are means ± SEM (n = 2). P-value of the significant pairwise comparison against control (+P = 0.1–0.05, *P = 0.05–0.01, **P = 0.01–0.001, ***P ≤ 0.001).
Figure 5
Figure 5
Cell cycle study. (a) Bar graphs illustrate results of T98G cell cycle analysis, indicating the percentage of cells in the G0/G1, S, and G2/M cell cycle phases following 24 h treatment with concentrations of 0.5, 1, and 2 mg/mL DAV and with TMZ at 0.1 mg/mL. Below, representative histogram plots of cell cycle distribution showing DNA content in each phase. (b) The same analysis as (a) is shown for HACAT cells. Values in brackets stand for compound concentration in mg/mL. Linear mixed models to assess the effects of treatments were used as described in Fig. 1. Data are means ± SEM (n = 2).
Figure 6
Figure 6
The effects of DAV in T98G and HACAT cell apoptosis were analyzed by flow cytometry at 72 h. (a) Early apoptotic (Annexin V-positive, PI-negative), late apoptotic (Annexin V-positive and PI-positive), and necrotic cells (Annexin V-negative and PI-positive) were included in cell death determinations by flow cytometry at 72 h. An example of T98G cells is shown. (b) Percentage of T98 early apoptotic cells (left) and HACAT early apoptotic cells (right) following treatment with concentrations of 0.5, 1, and 2 mg/mL DAV and with TMZ at 0.1 mg/mL. (c,d) The same analysis as (a) is shown for late apoptotic cells and necrotic cells, respectively. Values in brackets stand for compound concentration in mg/mL. Linear mixed models to assess the effects of treatments were used as described in Fig. 1. Data are means ± SEM (n = 2).

References

    1. Li C, Chu W. The regenerating antler blastema: The derivative of stem cells resident in a pedicle stump. Front. Biosci. (Landmark Edition) 2016;1(21):455–467. doi: 10.2741/4401. - DOI - PubMed
    1. Landete-Castillejos T, et al. Antlers—Evolution, development, structure, composition, and biomechanics of an outstanding type of bone. Bone. 2019;22(128):115046. doi: 10.1016/j.bone.2019.115046. - DOI - PubMed
    1. Li C, Clark D, Lord E, Stanton J, Suttie J. Sampling technique to discriminate the different tissue layers for gene discovery from the growing deer antler tip. Anat. Rec. 2002;268:125–130. doi: 10.1002/ar.10120. - DOI - PubMed
    1. Gomez S, et al. Labeling studies on cortical bone formation in the antlers of red deer (Cervus elaphus) Bone. 2013;52:506–515. doi: 10.1016/j.bone.2012.09.015. - DOI - PubMed
    1. Goss RJ. Future directions in antler research. Anat. Rec. 1995;241:291–302. doi: 10.1002/ar.1092410302. - DOI - PubMed

Publication types

LinkOut - more resources