

Causes of variations of trace and rare earth elements concentration in lakes bottom sediments in the Bory Tucholskie National Park, Poland
- PMID: 33420195
- PMCID: PMC7794470
- DOI: 10.1038/s41598-020-80137-z
Causes of variations of trace and rare earth elements concentration in lakes bottom sediments in the Bory Tucholskie National Park, Poland
Abstract
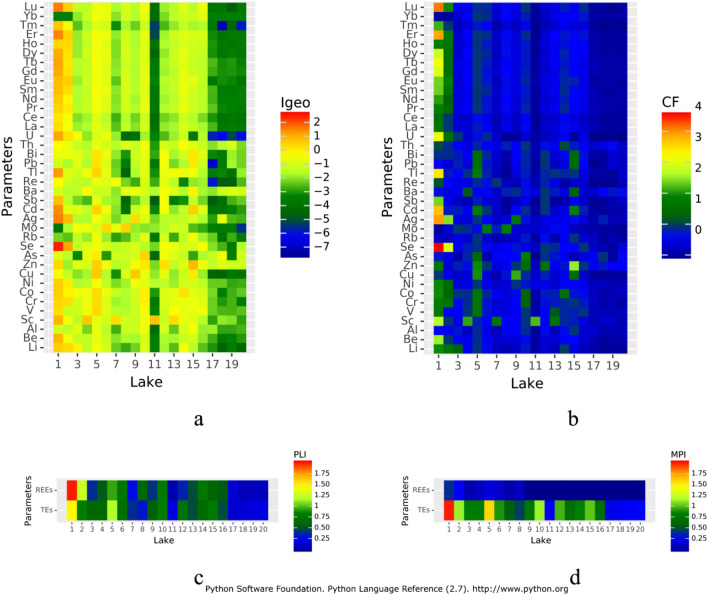
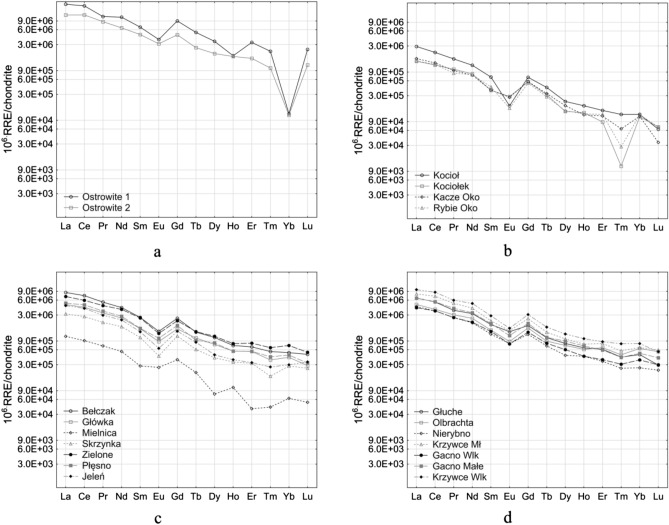
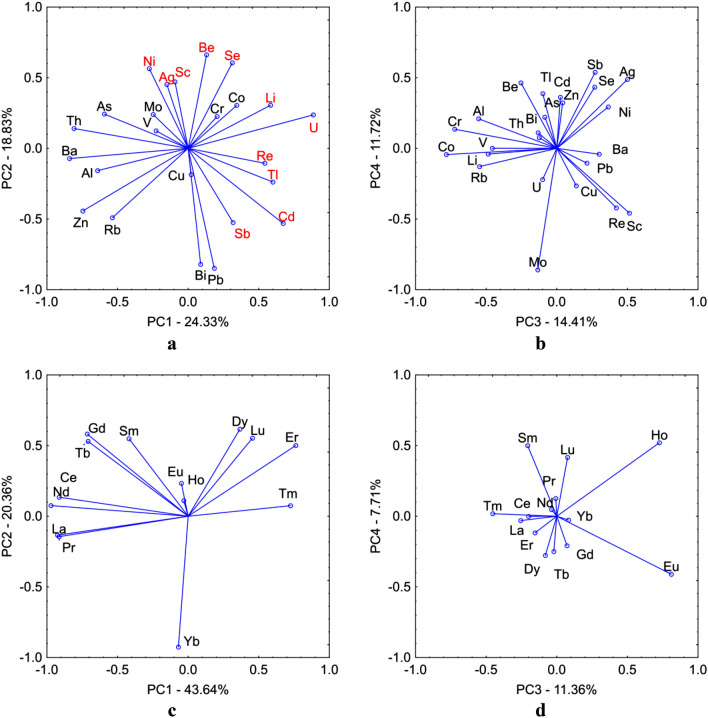
The objective of this study was to analyse spatial variability of the trace elements (TEs) and rare earth elements (REEs) concentration in lake bottom sediments in Bory Tucholskie National Park (BTNP); Poland. The following research questions were posed: which factors have a fundamental impact on the concentration and spatial variability of elements in bottom sediments, which of the elements can be considered as indicators of natural processes and which are related to anthropogenic sources. The research material was sediments samples collected from 19 lakes. The concentrations of 24 TEs and 14 REEs were determined. The analyses were carried out using the inductively coupled plasma mass spectrometry (ICP-QQQ). Cluster analysis and principal component analysis were used to determine the spatial variability of the TEs and REEs concentrations, indicate the elements that are the indicators of natural processes and identify potential anthropogenic sources of pollution. The geochemical background value (GBV) calculations were made using 13 different statistical methods. However, the contamination of bottom sediments was evaluated by means of the index of geo-accumulation, the enrichment factor, the pollution load index, and the metal pollution index. The BTNP area is unique because of its isolation from the inflow of pollutants from anthropogenic sources and a very stable land use structure over the last 200 years. This study shows high variability of TE and REE concentrations in lake sediments. The values of geochemical indices suggest low pollution of lakes bottom sediments. It was found that TEs originated mainly from geogenic sources. However, the concentrations of Li, Ni, Sc, Se, Be, Se, Ag, Re, Tl, Cd, Sb and U may be related to the impact of point sources found mainly in the Ostrowite Lake. Almost all REEs concentrations were strongly correlated and their presence was linked to with geochemical processes. The elements allowing to identify natural processes and anthropogenic pollution sources were Cr, Co, Cu, Ag, Cd, Zn, Bi, Re, Ba, Al and Rb in TEs group and Nd, Gd, Yb, Lu, Eu, Dy and Ce in REEs group. The analysis shows high spatial variability of TE and REE concentrations in lake sediments. The values of geochemical indices point to low pollution of lakes sediments. The anthropogenic sources only for two lakes had an impact on concentrations of selected TEs and REEs. The analyses allowed to identify elements among TEs and REEs documenting geochemical processes and those indicating anthropogenic sources of pollution.
Conflict of interest statement
The authors declare no competing interests.
Figures


Similar articles
-
Assessing anthropogenic levels, speciation, and potential mobility of rare earth elements (REEs) in ex-tin mining area.Environ Sci Pollut Res Int. 2016 Dec;23(24):25039-25055. doi: 10.1007/s11356-016-7641-x. Epub 2016 Sep 27. Environ Sci Pollut Res Int. 2016. PMID: 27677993
-
Discrimination of rare earth element geochemistry and co-occurrence in sediment from Poyang Lake, the largest freshwater lake in China.Chemosphere. 2019 Feb;217:851-857. doi: 10.1016/j.chemosphere.2018.11.060. Epub 2018 Nov 11. Chemosphere. 2019. PMID: 30458420
-
Rare earth and precious elements in the urban sewage sludge and lake surface sediments under anthropogenic influence in the Republic of Benin.Environ Monit Assess. 2017 Nov 9;189(12):625. doi: 10.1007/s10661-017-6331-6. Environ Monit Assess. 2017. PMID: 29124371
-
Research progress on the content and distribution of rare earth elements in rivers and lakes in China.Mar Pollut Bull. 2023 Jun;191:114916. doi: 10.1016/j.marpolbul.2023.114916. Epub 2023 Apr 13. Mar Pollut Bull. 2023. PMID: 37058831 Review.
-
Rare Earth Elements Uptake by Synthetic Polymeric and Cellulose-Based Materials: A Review.Polymers (Basel). 2022 Nov 7;14(21):4786. doi: 10.3390/polym14214786. Polymers (Basel). 2022. PMID: 36365775 Free PMC article. Review.
Cited by
-
Heavy metals in lake surface sediments in protected areas in Poland: concentration, pollution, ecological risk, sources and spatial distribution.Sci Rep. 2022 Sep 2;12(1):15006. doi: 10.1038/s41598-022-19298-y. Sci Rep. 2022. PMID: 36056130 Free PMC article.
-
ICP-MS Measurement of Trace and Rare Earth Elements in Beach Placer-Deposit Soils of Odisha, East Coast of India, to Estimate Natural Enhancement of Elements in the Environment.Molecules. 2021 Dec 11;26(24):7510. doi: 10.3390/molecules26247510. Molecules. 2021. PMID: 34946589 Free PMC article.
-
Bird nesting boxes as a specific artificial microenvironment increasing biodiversity of mites from the suborder Uropodina (Acari: Mesostigmata): a case study of Bory Tucholskie National Park.Exp Appl Acarol. 2024 Jun;93(1):141-153. doi: 10.1007/s10493-024-00912-9. Epub 2024 Jun 13. Exp Appl Acarol. 2024. PMID: 38869729 Free PMC article.
-
Assessment of the Anthropogenic Impact and Distribution of Potentially Toxic and Rare Earth Elements in Lake Sediments from North-Eastern Romania.Toxics. 2022 May 10;10(5):242. doi: 10.3390/toxics10050242. Toxics. 2022. PMID: 35622655 Free PMC article.
-
Geochemical Responses to Natural and Anthropogenic Settings in Salt Lakes Sediments from North-Eastern Romanian Plain.Int J Environ Res Public Health. 2023 Jan 4;20(2):935. doi: 10.3390/ijerph20020935. Int J Environ Res Public Health. 2023. PMID: 36673692 Free PMC article.
References
-
- Sojka M, Siepak M, Gnojska E. Assessment of heavy metal concentration in bottom sediments of Stare Miasto pre-dam reservoir on the Powa River. Rocz. Ochr. Śr. 2013;15(1):1916–1928.
-
- Sojka M, Siepak M, Jaskuła J, Wicher-Dysarz J. Heavy metal transport in a river-reservoir system: A case study from Central Poland. Pol. J. Environ. Stud. 2018;27:1725–1734. doi: 10.15244/pjoes/76916. - DOI
-
- Sahoo PK, et al. Geochemical characterization of the largest upland lake of the Brazilian Amazonia: Impact of provenance and processes. J. S. Am. Earth Sci. 2017;80:541–558. doi: 10.1016/j.jsames.2017.10.016. - DOI
-
- Sahoo PK, et al. Geochemistry of upland lacustrine sediments from Serra dos Carajas, Southeastern Amazon, Brazil: Implication for catchment weathering, provenance, and sedimentary processes. J. S. Am. Earth Sci. 2016;72:178–190. doi: 10.1016/j.jsames.2016.09.003. - DOI
-
- Sahoo PK, et al. High resolution hydrogeochemical survey and estimation of baseline concentrations of trace elements in surface water of the Itacaiúnas River Basin, southeastern Amazonia. J. Geochem. Explor. 2019;205:106321. doi: 10.1016/j.gexplo.2019.06.003. - DOI
Publication types
LinkOut - more resources
Full Text Sources
Other Literature Sources
Miscellaneous
