Comparative Study
. 2021 Jan 8;4(1):54.
doi: 10.1038/s42003-020-01571-3.

Chimpanzee histology and functional brain imaging show that the paracingulate sulcus is not human-specific

Affiliations
Comparative Study

Chimpanzee histology and functional brain imaging show that the paracingulate sulcus is not human-specific

Céline Amiez et al. Commun Biol. .

Abstract

The paracingulate sulcus -PCGS- has been considered for a long time to be specific to the human brain. Its presence/absence has been discussed in relation to interindividual variability of personality traits and cognitive abilities. Recently, a putative PCGS has been observed in chimpanzee brains. To demonstrate that this newly discovered sulcus is the homologue of the PCGS in the human brain, we analyzed cytoarchitectonic and resting-state functional magnetic resonance imaging data in chimpanzee brains which did or did not display a PCGS. The results show that the organization of the mid-cingulate cortex of the chimpanzee brain is comparable to that of the human brain, both cytoarchitectonically and in terms of functional connectivity with the lateral frontal cortex. These results demonstrate that the PCGS is not human-specific but is a shared feature of the primate brain since at least the last common ancestor to humans and great apes ~6 mya.


Conflict of interest statement

The authors declare no competing interests.

Figures

Fig. 1
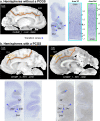
Fig. 1. Morphological and cytoarchitectonic organization of the cingulate cortex in hemispheres without or with a PCGS in the human brain.
a In hemispheres displaying no PCGS, the CGS starts at the intersection with the supra-rostral sulcus (SUROS) and the sulcus sus-orbitalis (SOS) in front of the genu of the corpus callosum. b In hemispheres with a PCGS, it is the PCGS that starts rostrally at the intersection with the SUROS and the SOS,. c The 4-regions model is represented in a hemisphere displaying a PCGS. This model identifies the limit between the ACC and the aMCC at the level of the anterior limit of the genu of the corpus callosum, the limit between the aMCC and the pMCC as being the anterior commissure. In the aMCC, when a PCGS is present, both banks of the CGS are occupied by area 24c′ whereas the ventral bank of the PCGS is occupied by area 32′. When a PCGS is absent, the ventral and dorsal banks of the CGS are respectively occupied by area 24c′ and 32′. d Cytoarchitectonic organization of the aMCC in hemispheres with and without a PCGS, as shown on coronal sections at the anteroposterior level displayed by the blue line in (c). a anterior, p posterior, d dorsal, v ventral, AC anterior commissure, cc corpus callosum, ACC anterior cingulate cortex, CGS cingulate sulcus, MCC mid-cingulate cortex, PCC posterior cingulate cortex, RSC retrosplenial cortex, PCGS paracingulate sulcus, SU-ROS supra-rostral sulcus, SOS sulcus sus-orbitalis. Figure 1c modified from Supplementary Fig. 3 in Amiez et al..
Fig. 2
Fig. 2. Occurence of the PCGS in the ACC and MCC in the chimpanzee and the human brains.
Probability of occurrence of a PCGS in the ACC (a), the MCC (b), or in both ACC and MCC (c) in chimpanzee versus human brains. The putative limit between ACC and MCC is represented by the dashed line. CGS and PCGS correspond to the red and yellow lines, respectively. Left diagrams show that, in hemispheres displaying a PCGS (i.e., in n = 183 human brain hemispheres and n = 91 chimpanzee brain hemispheres), the probability of occurrence of a PCGS in the ACC as well as in both the ACC and the MCC is higher in human than in chimpanzee brains (dependent variable: PCGS present (0/1), main effect species: χ2 = 49.7, df = 1, p-value = 1.79e−12, logistic regression). By contrast, the probability of occurrence of a PCGS in the MCC is similar in human and chimpanzee (dependent variable: PCGS present in MCC (0/1), main effect species: χ2 = 2.9, df = 1, p-value = 0.09, logistic regression). ACC anterior cingulate cortex, LH left hemisphere, MCC mid-cingulate cortex, PCGS paracingulate sulcus, ***p < 0.001, logistic regression; ns non-significant logistic regression.
Fig. 3
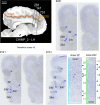
Fig. 3. Impact of the presentce of a PCGS on the cytoarchitectonic organization of the anterior MCC.
Cytoarchitectonic organization of the anterior MCC in hemispheres without (a) and with (b) a PCGS. a The MCC of the left hemisphere of CHIMP_1 is presented on a sagittal view of a post-mortem MRI scan (left panel). The CGS is marked in red. The coronal section presented on the middle panel corresponds to the antero-posterior level defined by a black line on the MRI image (slice 482). The right panels present the labeled and raw Nissl-stained slices. The black lines represent the limits between areas. The gray zones identified by a blue arrow correspond to transition zones between two adjacent cytoarchitectonic areas. Area 24c′ occupies the ventral bank of the CGS and area 32′ occupies the dorsal bank of the CGS. The photomicrographs of area 32′ (corresponding to the region identified by a blue box on the coronal section) and area 24c′ (corresponding to the region identified by a green box on the coronal section) are displayed on the right panels. Results show the presence of a dysgranular layer 4 (in red are displayed the granular patches) in area 32′ and the absence of this layer in area 24c′. b The MCC of the right hemispheres of CHIMP_3 and CHIMP_1 are presented on sagittal views of post-mortem MRI scans. The CGS is marked in red, the PCGS in orange. The coronal sections presented on each Nissl-stained slices correspond to the antero-posterior levels defined by a black line on the MRI images (CHIMP_3: slice 781, CHIMP_1: slice 821). In both chimpanzees, area 24c′ occupies the ventral bank, the fundus, and the lateral-most part of the dorsal bank of the CGS. Area 32′ occupies the dorsal bank of the CGS, the gyrus between the CGS and the PCGS and the ventral bank of the PCGS. CGS cingulate sulcus, MRI magnetic resonance imaging, PCGS paracingulate sulcus, L1-6 cytoarchitectonic layers 1-6, SWM superficial white matter.
Fig. 4
Fig. 4. Cytoarchitectonic organization of the anterior MCC of a hemisphere displaying a PCGS in its anterior part and no PCGS in its posterior part.
The MCC of the left hemisphere of CHIMP_2 is presented on a sagittal view of a post-mortem MRI scan. The CGS is marked in red, the PCGS in orange. The Nissl-stained coronal sections presented correspond to the antero-posterior levels defined by a black line on the MRI images (slice 281 where the PCGS is absent, slices 141 and 701 where the PCG is present). On slice 281 where the PCGS is absent, (1) area 24c′ occupies the ventral bank, the fundus, and the lateral-most part of the dorsal bank of the CGS, (2) area 32′ occupies the dorsal bank of the CGS, the gyrus between the CGS and the PCGS and the ventral bank of the PCGS. On slices 141 and 701 where the PCGS is present, (1) area 24c′ occupies the ventral bank, the fundus, and the lateral-most part of the dorsal bank of the CGS, (2) area 32′ occupies the dorsal bank of the CGS, the gyrus between the CGS and the PCGS and the ventral bank of the PCGS. The gray zones identified by a blue arrow correspond to transition zones between two adjacent cytoarchitectonic areas. The photomicrographs of area 32′ (corresponding to the region identified by a blue box on the coronal section of slice #701) and area 24c′ (corresponding to the region identified by a green box on the coronal section of slice #701) are displayed on the right panels. Results show the presence of a dysgranular layer 4 (in red are displayed the granular patches) in area 32′ and the absence of this layer in area 24c′. CGS cingulate sulcus, PCGS paracingulate sulcus, LH left hemisphere, L1-6 cytoarchitectonic layers 1-6, SWM superficial white matter.
Fig. 5
Fig. 5. Intra-hemispheric rostro-caudal functional organization between areas 24c′ and 32′ with the lateral frontal cortex in hemispheres displaying a PCGS (a, N = 3) and no PCGS (b, N = 5).
a The location of each seed is shown in a typical example of a hemisphere displaying a PCGS (CHIMP_C – LH). The location of each region of interest (ROI) is shown on the cortical surface of the same hemisphere. The heat-map represents the averaged seed-ROI Z values in hemispheres displaying a PCGS. Boxplots displaying the mean ± SD Z-transformed connectivity between each seed (areas 24c′ and 32′) with the various ROIs in hemispheres displaying a PCGS. Results show that the correlation strength between Area 24c′ and Area 32′ with the prefrontal cortex is significantly higher than with the motor zones (Area 24c′: df = 7, F = 154.8, p < 2.2e−16; Area 32′: df = 7, F = 157, p < 2.2e−16, ANOVA). b The location of each seed is shown in a typical example of a hemisphere displaying no PCGS (CHIMP_B – LH). The heat-map represents the averaged seed-ROI Z values in hemispheres displaying a PCGS. Boxplots displaying the mean ± SD Z-transformed connectivity between each seed (areas 24c′ and 32′) with the various ROIs in hemispheres displaying no PCGS. Results show that the correlation strength between Area 24c’ and Area 32′ with the prefrontal areas is significantly higher than with the motor zones (Area 24c′: df = 7, F = 123.5, p < 2.2e−16; Area 32’: df = 7, F = 110.1, p < 2.2e−16, ANOVA). c Significant negative linear trend of connectivity (slope) of each seed with the rostral-caudal position of lateral frontal ROIs (ROIlines) in hemispheres displaying or not a PCGS. The ROIline was obtained by recoding the ROIs in terms of their relative rostro-caudal rank: 1, Area 10; 2, DLPFC; 3, Area 45; 4, Area 44; 5, Fo; 6, FEF; 7, M1Face; 8, M1Hand. Results show that these negative slopes were statistically similar for both seeds (Area 24c′ and Area 32′) and for both morphologies (presence or absence of a PCGS) (interaction between seed identity, seed location, and ROIline, F = 3.03, p > 0.05, ns, 3-ways ANOVA). LH left hemisphere; *** statistically significant at p < 0.001.

References

    1. Dunbar RIM, Shultz S. Why are there so many explanations for primate brain evolution? Phil. Trans. R. Soc. B. 2017;372:20160244. doi: 10.1098/rstb.2016.0244. - DOI - PMC - PubMed
    1. Barton RA, Montgomery SH. Proportional versus relative size as metrics in human brain evolution. Proc. Natl Acad. Sci. USA. 2019;116:3–4. doi: 10.1073/pnas.1817200116. - DOI - PMC - PubMed
    1. DeCasien AR, Williams SA, Higham JP. Primate brain size is predicted by diet but not sociality. Nat. Ecol. Evol. 2017;1:112. doi: 10.1038/s41559-017-0112. - DOI - PubMed
    1. Mars RB, et al. Primate comparative neuroscience using magnetic resonance imaging: promises and challenges. Front. Neurosci. 2014;8:298. doi: 10.3389/fnins.2014.00298. - DOI - PMC - PubMed
    1. DeCasien AR, Higham JP. Primate mosaic brain evolution reflects selection on sensory and cognitive specialization. Nat. Ecol. Evol. 2019;3:1483–1493. doi: 10.1038/s41559-019-0969-0. - DOI - PubMed

Publication types

LinkOut - more resources