

Elevated temperatures diminish the effects of a highly resistant rice variety on the brown planthopper
- PMID: 33420350
- PMCID: PMC7794346
- DOI: 10.1038/s41598-020-80704-4
Elevated temperatures diminish the effects of a highly resistant rice variety on the brown planthopper
Abstract
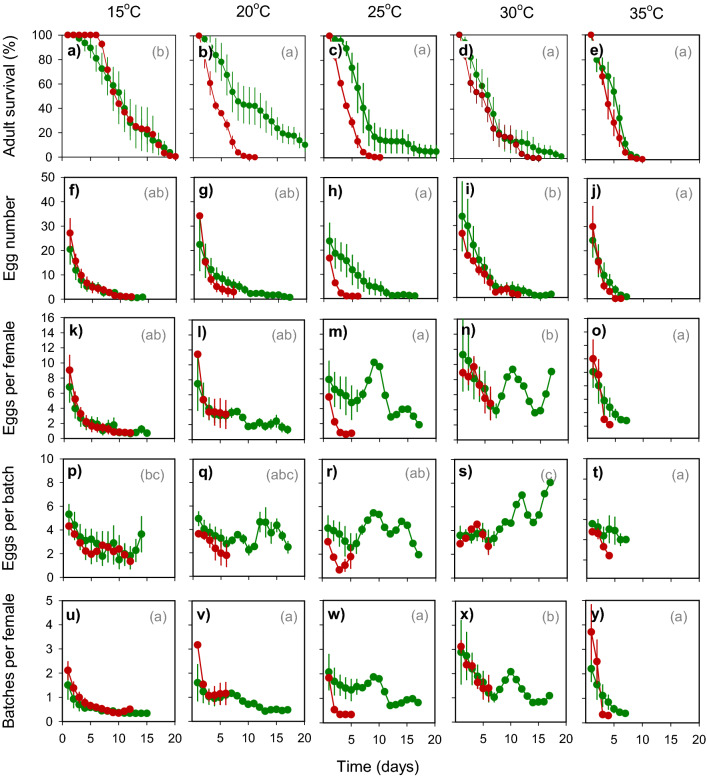
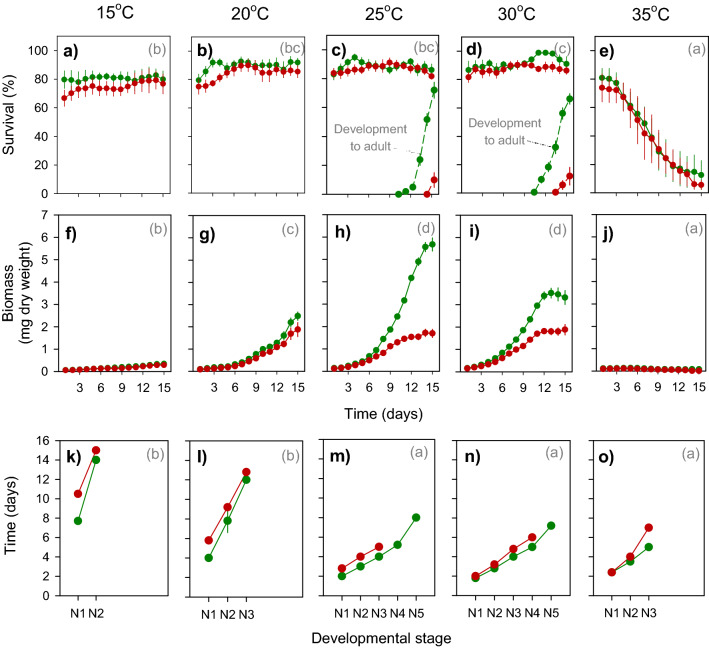
This study compares the effects of temperature (constant at 15, 20, 25, 30 and 35 °C) on adult longevity, oviposition, and nymph development of the brown planthopper, Nilaparvata lugens, on susceptible and resistant rice varieties. The resistant variety contained the BPH32 gene. In our experiments, nymphs failed to develop to adults at 15, 20 and 35 °C on either variety. Host resistance had its greatest effect in reducing adult survival at 20-25 °C and its greatest effect in reducing nymph weight gain at 25 °C. This corresponded with optimal temperatures for adult survival (20-25 °C) and nymph development (25-30 °C). At 25 and 30 °C, adult females achieved up to three oviposition cycles on the susceptible variety, but only one cycle on the resistant variety. Maximum egg-laying occurred at 30 °C due to larger numbers of egg batches produced during the first oviposition cycle on both the susceptible and resistant varieties, and larger batches during the second and third oviposition cycles on the susceptible variety; however, resistance had its greatest effect in reducing fecundity at 25 °C. This revealed a mismatch between the optimal temperatures for resistance and for egg production in immigrating females. Increasing global temperatures could reduce the effectiveness of anti-herbivore resistance in rice and other crops where such mismatches occur.
Conflict of interest statement
The authors declare no competing interests.
Figures


Similar articles
-
Intraspecific competition counters the effects of elevated and optimal temperatures on phloem-feeding insects in tropical and temperate rice.PLoS One. 2020 Oct 6;15(10):e0240130. doi: 10.1371/journal.pone.0240130. eCollection 2020. PLoS One. 2020. PMID: 33022691 Free PMC article.
-
Temperature-dependent oviposition and nymph performance reveal distinct thermal niches of coexisting planthoppers with similar thresholds for development.PLoS One. 2020 Jun 30;15(6):e0235506. doi: 10.1371/journal.pone.0235506. eCollection 2020. PLoS One. 2020. PMID: 32603337 Free PMC article.
-
Leaf Chemical Compositions of Different Eggplant Varieties Affect Performance of Bemisia tabaci (Hemiptera: Aleyrodidae) Nymphs and Adults.J Econ Entomol. 2018 Feb 9;111(1):445-453. doi: 10.1093/jee/tox333. J Econ Entomol. 2018. PMID: 29272524
-
Heat-dependent fecundity enhancement observed in Nilaparvata lugens (Hemiptera: Delphacidae) after treatment with triazophos.Environ Entomol. 2014 Apr;43(2):474-81. doi: 10.1603/EN13249. Environ Entomol. 2014. PMID: 24763100
-
Genomics of interaction between the brown planthopper and rice.Curr Opin Insect Sci. 2017 Feb;19:82-87. doi: 10.1016/j.cois.2017.03.005. Epub 2017 Mar 18. Curr Opin Insect Sci. 2017. PMID: 28521948 Review.
Cited by
-
Intraspecific competition counters the effects of elevated and optimal temperatures on phloem-feeding insects in tropical and temperate rice.PLoS One. 2020 Oct 6;15(10):e0240130. doi: 10.1371/journal.pone.0240130. eCollection 2020. PLoS One. 2020. PMID: 33022691 Free PMC article.
-
Interactions between Rice Resistance to Planthoppers and Honeydew-Related Egg Parasitism under Varying Levels of Nitrogenous Fertilizer.Insects. 2022 Mar 1;13(3):251. doi: 10.3390/insects13030251. Insects. 2022. PMID: 35323548 Free PMC article.
-
Origins of Susceptibility to Insect Herbivores in High-Yielding Hybrid and Inbred Rice Genotypes.Insects. 2024 Aug 12;15(8):608. doi: 10.3390/insects15080608. Insects. 2024. PMID: 39194813 Free PMC article.
-
Positive and negative interspecific interactions between coexisting rice planthoppers neutralise the effects of elevated temperatures.Funct Ecol. 2021 Jan;35(1):181-192. doi: 10.1111/1365-2435.13683. Epub 2020 Oct 4. Funct Ecol. 2021. PMID: 33612910 Free PMC article.
-
"Physiological and demographic responses of Nilaparvata lugens to combined climate stressors: CO2, temperature, and ozone".Front Plant Sci. 2025 Jun 5;16:1518361. doi: 10.3389/fpls.2025.1518361. eCollection 2025. Front Plant Sci. 2025. PMID: 40538867 Free PMC article.
References
-
- NASA. Global Vital Signs: Vital Signs of the Planethttps://climate.nasa.gov/ (2019).
-
- Pachauri, R. K. et al. Climate Change 2014: synthesis report. Fifth Assessment Report on the Intergovernmental Panel on Climate Change 151. Geneva, Switzerland. (2014)
-
- Bale JS, et al. Herbivory in global climate change research: direct effects of rising temperature on insect herbivores. Glob. Change Biol. 2002;8:1–16. doi: 10.1046/j.1365-2486.2002.00451.x. - DOI
Publication types
MeSH terms
LinkOut - more resources
Full Text Sources
Other Literature Sources
