. 2021 Jan 8;4(1):59.
doi: 10.1038/s42003-020-01538-4.

Voltage-independent GluN2A-type NMDA receptor Ca2+ signaling promotes audiogenic seizures, attentional and cognitive deficits in mice

Affiliations

Voltage-independent GluN2A-type NMDA receptor Ca2+ signaling promotes audiogenic seizures, attentional and cognitive deficits in mice

Ilaria Bertocchi et al. Commun Biol. .

Erratum in

Abstract

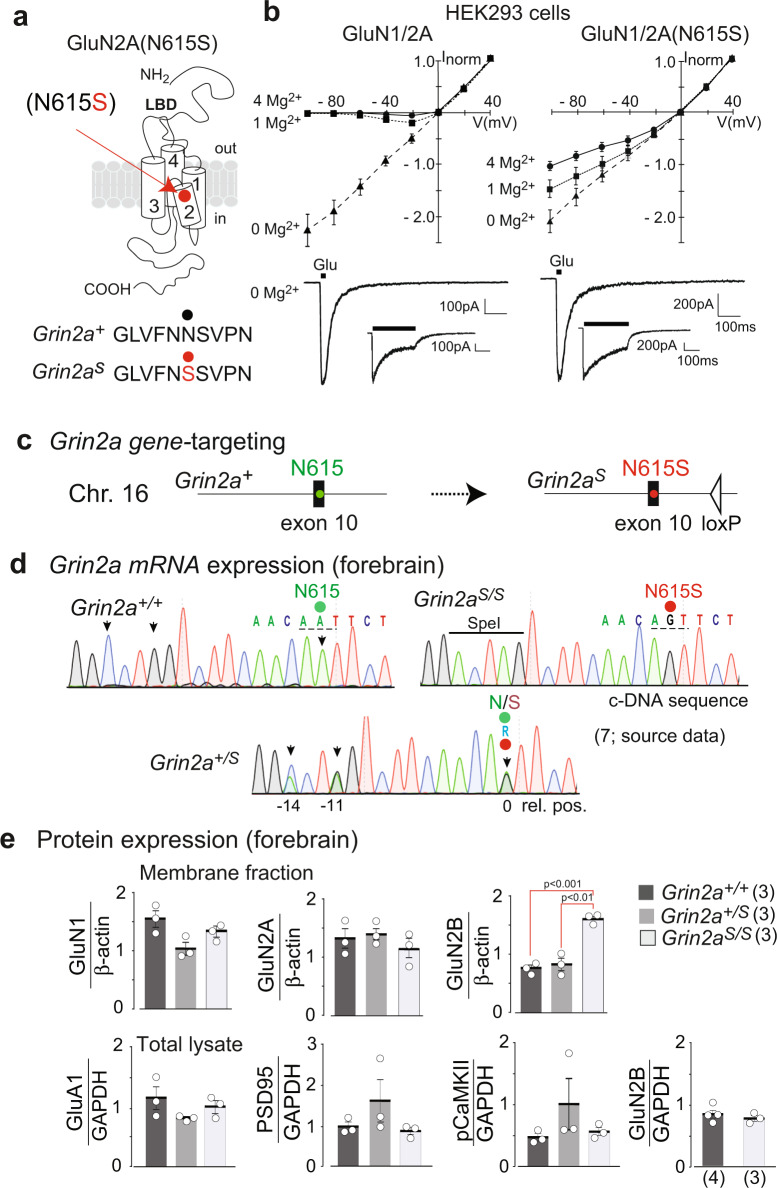
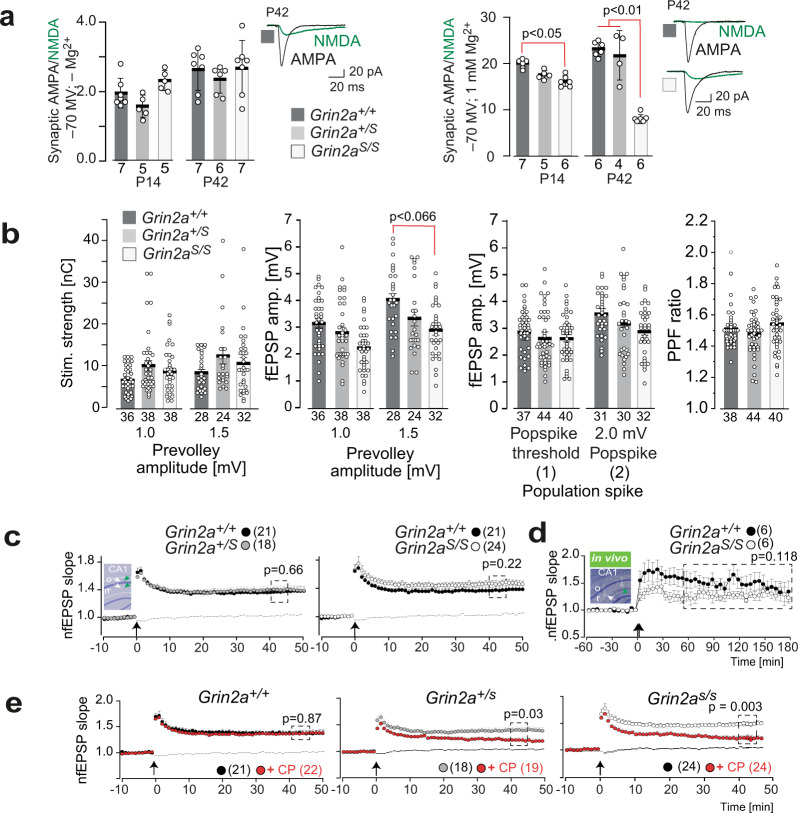
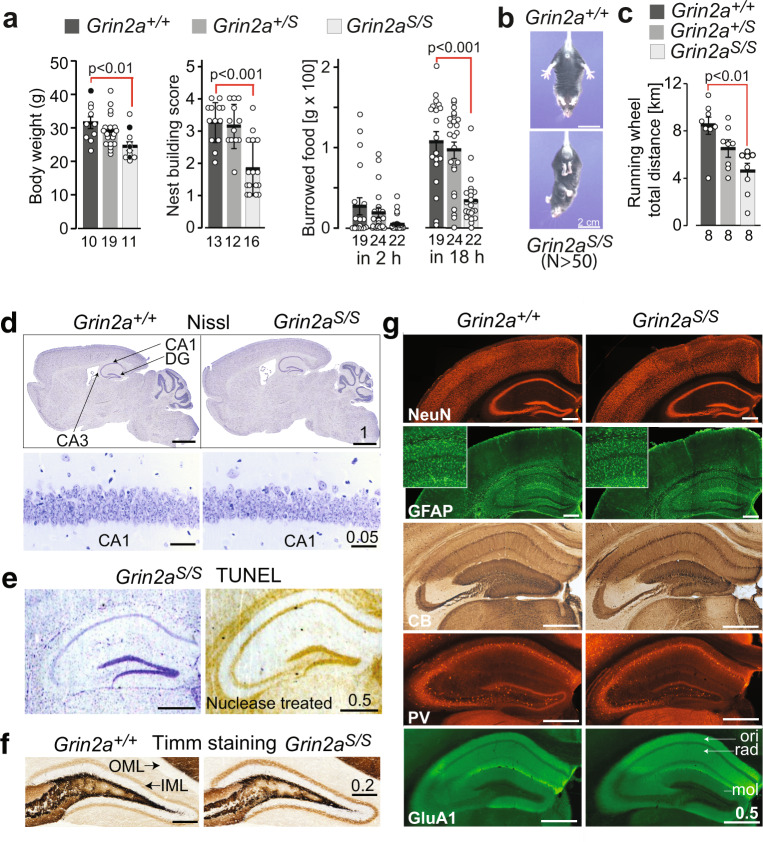
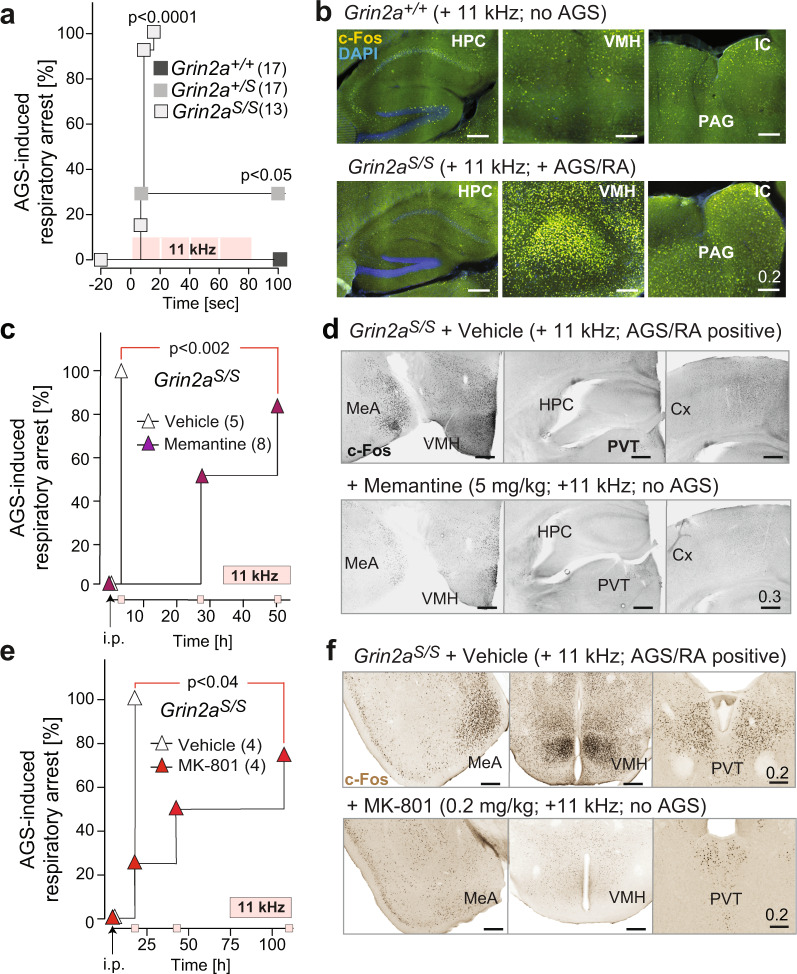
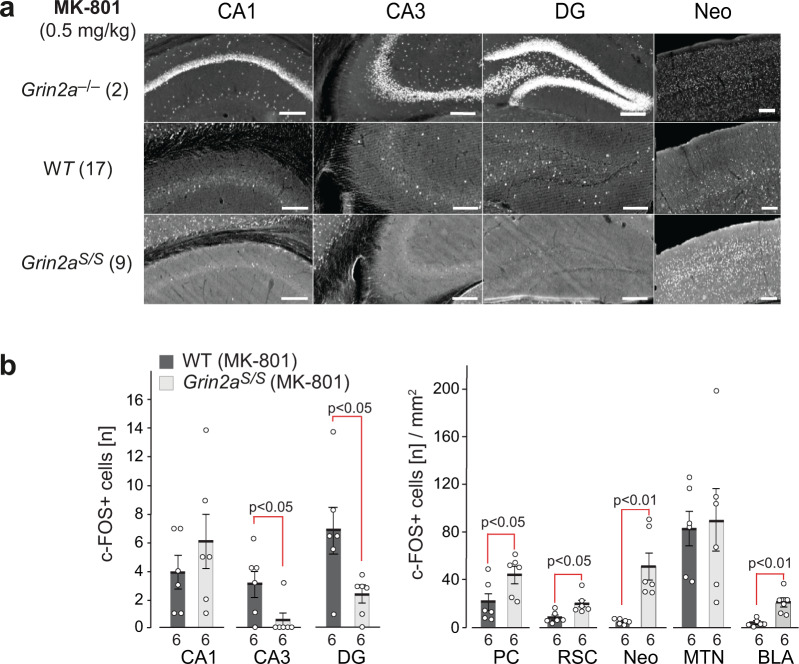
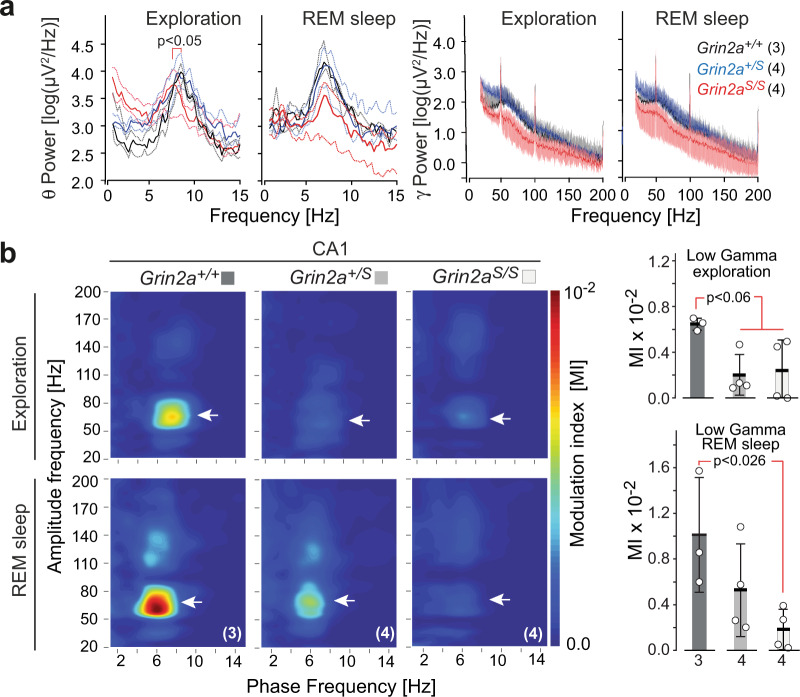
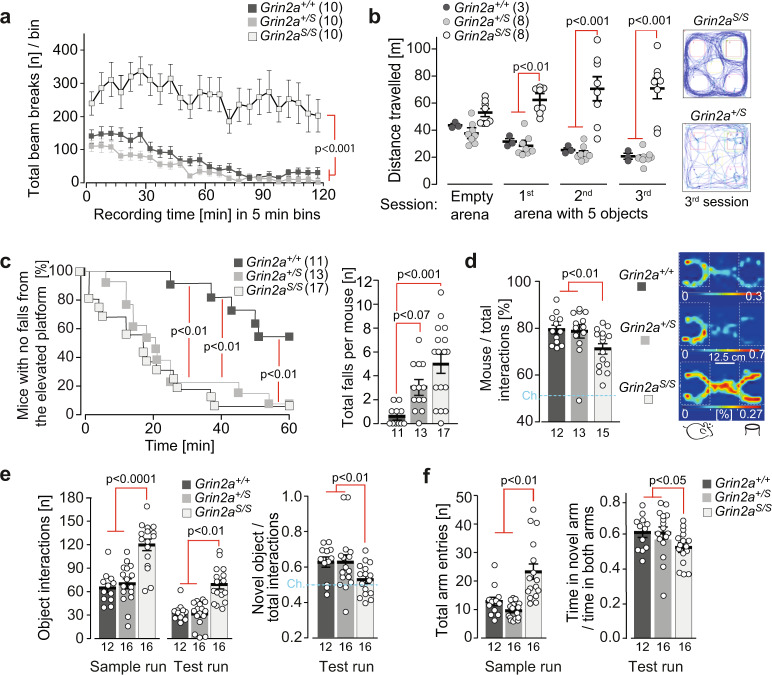
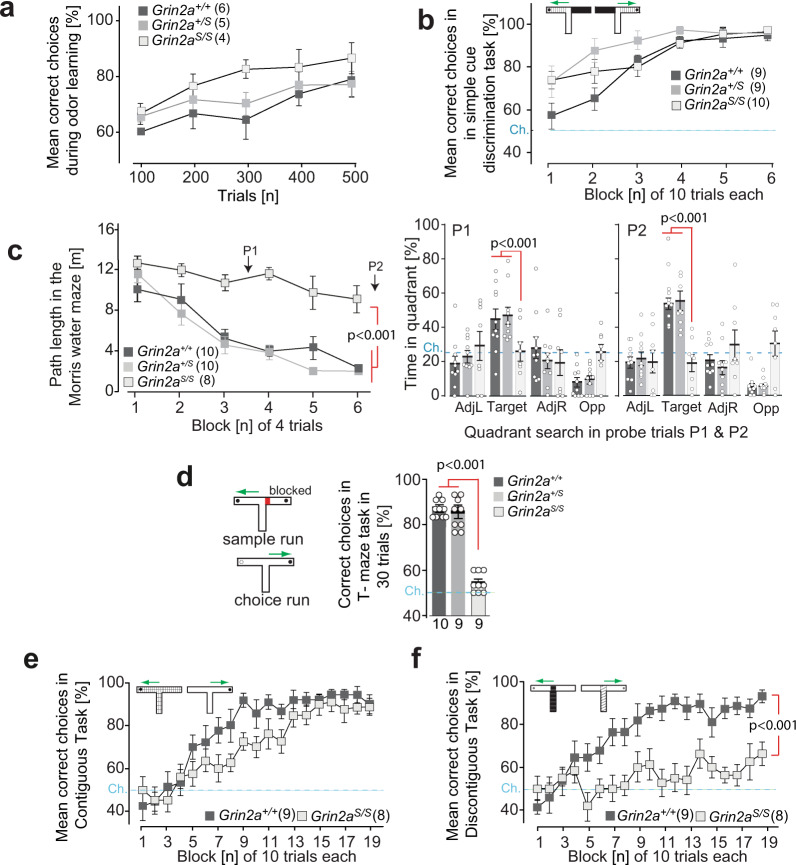
The NMDA receptor-mediated Ca2+ signaling during simultaneous pre- and postsynaptic activity is critically involved in synaptic plasticity and thus has a key role in the nervous system. In GRIN2-variant patients alterations of this coincidence detection provoked complex clinical phenotypes, ranging from reduced muscle strength to epileptic seizures and intellectual disability. By using our gene-targeted mouse line (Grin2aN615S), we show that voltage-independent glutamate-gated signaling of GluN2A-containing NMDA receptors is associated with NMDAR-dependent audiogenic seizures due to hyperexcitable midbrain circuits. In contrast, the NMDAR antagonist MK-801-induced c-Fos expression is reduced in the hippocampus. Likewise, the synchronization of theta- and gamma oscillatory activity is lowered during exploration, demonstrating reduced hippocampal activity. This is associated with exploratory hyperactivity and aberrantly increased and dysregulated levels of attention that can interfere with associative learning, in particular when relevant cues and reward outcomes are disconnected in space and time. Together, our findings provide (i) experimental evidence that the inherent voltage-dependent Ca2+ signaling of NMDA receptors is essential for maintaining appropriate responses to sensory stimuli and (ii) a mechanistic explanation for the neurological manifestations seen in the NMDAR-related human disorders with GRIN2 variant-meidiated intellectual disability and focal epilepsy.


Conflict of interest statement

The authors declare no competing interests.

Figures

Fig. 1
Fig. 1. GluN2A(N615S) containing NMDAR expression in vitro and in vivo.
a The position of N615 in the membrane segment M2 is depicted together with the three channel-forming trans-membrane segments M1, 3, and 4. b In HEK293 cells, recombinantly expressed GluN1/GluN2A and GluN1/GluN2A(N615S) channels were activated by fast glutamate application (1 mM; in the continuous presence of the co-agonist glycine, 10 µM) at holding potentials from –100 to +40 mV in different extracellular Mg2+ concentrations. NMDAR-mediated peak currents were normalized to those obtained at +40 mV. Data points represent mean ± SEM for n = 4–7 different HEK293 cells. Representative current traces evoked in 0 mM Mg2+ at – 60 mV, with 20 and 600 ms applications, are shown below the IV plots and were used to determine the current kinetics (Supplementary Table 1). c Schematic view of the A to G replacement in exon 10 of the mouse Grin2a gene. d Reverse transcription PCR (RT-PCR)-sequence analyses of total brain mRNA show the A-to-G mutation in pos. 0 and two diagnostic silent mutations at pos. –11 and –14 in the pore loop encoding gene segment in Grin2a+/+, Grin2aS/S, Grin2a+/S mice. In Grin2a+/S mice, the overlay of two different colored “nucleotide” peaks, at position 0, –11, and –14 indicate equimolar amounts of mRNA from the Grin2a+ and the targeted Grin2aS alleles. e Immunoblots of forebrain protein lysates of 4-week-old mice (Supplementary Fig. 2) indicate no genotype-specific differences of GluN1, GluN2A, and the AMPAR subunit GluA1 expression relative to the β-actin levels (p > 0.05). The levels of PSD95 and αCaMKII (in its phosphorylated state, pCaMKII) are also comparable between genotypes relative to the GAPDH expression. The GluN2B expression level in the membrane fraction was significantly increased in Grin2aS/S mice when compared to Grin2a+/+ and Grin2a+/S mice but not in the levels of total protein lysates (for statistics: Supplementary Statistics to Fig. 1). The number of mice is given in brackets. Error bars represent mean ± SEM.
Fig. 2
Fig. 2. Hippocampal synaptic transmission and plasticity in Grin2aS/S and Grin2a+/S mice with the GluN2A(N615S) mutation.
a (left) In the absence of extracellular Mg2+ the synaptic AMPA/NMDA ratio of CA1 pyramidal cells in acute hippocampal slices is not altered in Grin2a+/S and Grin2aS/S mice compared to control littermates. (right) In the presence of extracellular Mg2+ the strong reduction of the AMPA/NMDA ratio in Grin2aS/S mice relates to the increased NMDA currents at CA1 synapses (Tukey’s test). Example traces are depicted to the right of each bar graph. Data from the same experimental group were pooled across animals and are presented as mean ± SEM (see also ref. ) with p < 0.05 being designated as statistically significant. Numbers in bar graphs indicate the number of slices. b Paired-pulse facilitation at CA3-to-CA1 synapses excluded strong alterations of presynaptic function in mutant mice. The stimulation strengths (in nC) necessary to elicit a pre-volley of 1.0 and 1.5 mV and the resulting fEPSP amplitudes were comparable in all genotypes but showed only a trend towards lower fEPSP amplitudes recorded at 1.5 mV pre-volley amplitudes in Grin2aS/S mice. The fEPSP amplitudes necessary to elicit a just detectable population spike (1) and a population spike of 2 mV amplitude (2) and the paired-pulse facilitation ratio (PPF) at an interstimulus interval of 50 ms did not indicate any synaptic impairments in Grin2aS/S and Grin2a+/S mice compared to WT littermates. The number of slices is indicated in the bar graphs or in brackets. c Field LTP (fLTP) at CA3-to-CA1 synapses, induced by tetanic stimulation in slices (1 s; 100 Hz; arrow), was comparable in all three genotypes. The inset in c gives a schematic view of the stimulating (white arrow) and the recording (green arrow) electrode positions in str. radiatum (r) and str. oriens (o). d Similarly, CA1-to-CA3 fLTP (induction: 2 × 1 s; 100 Hz; arrow) in freely moving mice was comparable between Grin2aS/S and Grin2a+/+ mice. The inset shows a Nissl-stained slice of one recorded mouse post mortem. e In mutant mice, but not in control littermates, the GluN2B-containing NMDAR contributes significantly to the magnitude of LTP, since LTP was significantly reduced by the GluN2B-specific antagonist CP101,106 (CP). Recordings of the non-tetanized control pathway in c and e are given as dashed lines. Error bars represent mean ± SEM (for statistics: Supplementary Statistics to Fig. 2).
Fig. 3
Fig. 3. Grin2aS/S mice are viable and show no signs of neurodegeneration or altered brain structure.
a Grin2aS/S mice had a reduced body weight (by 18% in adults), significantly lower score in nesting and in overnight burrowing activity (filled circles: 30-week-old mice, white dots: 18-week-old mice). b Grin2aS/S mice showed the clasping reflex. c During the 12 h dark phase on the Lafayette running wheel the running distance is reduced in Grin2aS/S mice. d Nissl staining revealed unaltered cell density throughout the brain (top) and layering of hippocampal subfields, including CA1 (bottom), in Grin2aS/S mice compared to Grin2a+/+. Error bars represent mean ± SEM. e In the TUNEL assay no apoptotic cells could be detected in the hippocampus of Grin2aS/S mice, compared to the staining of the nuclease-treated positive control slice. f No aberrant mossy fiber sprouting in either genotype in the dentate gyrus inner (IML) and outer molecular layer (OML) can be found by Timm staining of coronal sections. g The distribution of NeuN-positive neurons and of GFAP-positive glial cells are indistinguishable between Grin2aS/S and Grin2a+/+ mice. Mossy fiber projections visualized by anti-calbindin (CB) staining, as well as numbers of parvalbumin (PV)-positive interneurons are similar between both genotypes. Anti-GluA1 immunosignal in all hippocampal layers is comparable between brain sections of Grin2aS/S mice and control littermates. CA1 cornu ammonis region 1, CA3 cornu ammonis region 3, DG dentate gyrus, mol stratum moleculare, ori stratum oriens, rad, stratum radiatum. Scale bars in dg are in mm. The number of animals is given below the bars. For the Nissl stain, Tunnel test and Timm stain 3 mice were used per genotype. For the immunohistological analysis of glial fibrillary acidic protein (GFAP), neuronal nuclear antigen (NeuN), Calbindin (CB), and Parvalbumin (PV) five mice and for the GluA1 immunofluorescence stain, three mice were used (for statistics: Supplementary Statistics to Fig. 3).
Fig. 4
Fig. 4. Grin2aS/S mice are susceptible to brainstem-derived AGS that can be rescued by NMDAR antagonists.
a Mortality curve showing that none of the Grin2a+/+ controls were affected, while audiogenic seizures (AGSs) followed by respiratory arrest (RA) were induced in all Grin2aS/S mice and in a subset of heterozygous Grin2a+/S mutants during the 11 kHz tone exposure [4 repetitions × 20 s tone, 2 s brake; pink squares; p < 0.0001 by Log-rank (Mantel–Cox) test]. b The c-Fos immunoreactivity was specifically increased in the hypothalamus (VMH), the inferior colliculus (IC), and periaqueductal gray (PAG) but not in the hippocampus (HPC) of a resuscitated Grin2aS/S mouse 90 min after AGS when compared to tone-exposed Grin2a+/+ littermates. c Memantine i.p. injection in Grin2aS/S mice, 3 h before tone exposure, rescued AGS susceptibility in Grin2aS/S mice. The rescue effect could still be observed in four out of eight, and in two out of eight, mice 27 and 51 h after memantine treatment, respectively. d Increased c-Fos immunofluorescence (in grayscale) in the medial amygdala (MeA) and the VMH of a Grin2aS/S animal with AGS (saline injection) compared to a memantine rescued Grin2aS/S littermate. In the paraventricular nucleus of the thalamus (PVT), the hippocampus (HPC) and cortex (Cx) there was no difference in c-Fos expression between memantine-injected and saline-injected animals (for fluorescence images, see Supplementary Fig. 5). e As in Fig. 4c but now MK-801 and saline are used for pre-treatment. The MK-801 effect was longer lasting compared to memantine and one out of four animals showed resistance to tone exposure even 4 days after MK-801 injection. f Decreased c-Fos DAB immunosignal in an MK-801 AGS-rescued Grin2aS/S animal (bottom) in the medial amygdala (MeA), the VMH and the PVT when compared to saline-injected Grin2aS/S littermate (top). Scale bars are in mm (for statistics: Supplementary Statistics to Fig. 4).
Fig. 5
Fig. 5. MK-801-induced c-Fos expression is reduced in DG granular and CA3 pyramidal cells of Grin2aS/S mice.
C-Fos expression 120 min after i.p. injection of MK-801. a C-Fos DAB immunosignals are depicted for one representative brain section of the different genotypes as indicated. The original images, including the cortical regions and results of PBS injected animals, are presented in Supplementary Fig. 6. The number of mice analyzed is given in brackets. b For quantitative comparisons the total numbers of c-Fos-positive cells in the cellular layers of the hippocampus were counted. C-Fos-positive cells in extra-hippocampal regions are given per mm2. Slices from six mice per genotype were used for the statistical analyses (two-tailed t-tests) and error bars represent mean ± SEM. CA1 and CA3 cornu ammonis regions 1 and 3, DG dentate gyrus, PC piriform cortex, RSC retrosplenial cortex, Neo neocortex, MTN midline thalamic nuclei, BLA basolateral amygdala. All scale bars: 0.2 mm.
Fig. 6
Fig. 6. Adult GluN2A(N615S) mutant mice express altered hippocampal oscillations during wakefulness and REM sleep.
a (left) Peak frequencies during exploration and rapid eye movement (REM) sleep for theta (0–15 Hz, left diagrams) and gamma oscillations (15–200 Hz, right diagrams) in all genotypes. During exploration, the average theta range peak frequencies were at 8.61 ± 0.07 and 8.75 ± 0.28 Hz for Grin2a+/+ mice and Grin2a+/S mice, respectively. In Grin2aS/S mice the theta range peak frequency was significantly slower, measuring 7.43 ± 0.24 Hz (Kruskal Wallis test, p = 0.0159). During REM sleep the average frequency ranges of Grin2a+/+ and Grin2a+/S mice were around 7.00 ± 0.20 Hz whereas Grin2aS/S mice had a lower but not significantly different range 6.71 ± 0.22 Hz. a (right) No significant differences on the low and high gamma frequency bands—ranges between 20–100 Hz and 100–200 Hz, respectively—could be detected between genotypes, neither during exploration nor in REM sleep. The number of mice used in this experiment are given with the name of the genotypes. b (left) Grin2aS/S and Grin2a+/S mice show reduced theta-gamma phase–amplitude coupling as determined by the modulation index (MI) in the low gamma component in CA1 (white arrowheads) during awake and REM sleep states. b (right) For Grin2aS/S the MI value dropped significantly during exploration and REM sleep although the MI reduction reached significance only during exploration (one-way ANOVA, Kruskal–Wallis test).  Numbers below bars of bar graphs indicate the number of animals. Error bars represent mean ± SEM.
Fig. 7
Fig. 7. Grin2aS/S mice are hyperactive and show increased attention and lack of inhibition.
a The total locomotor activity during the entire 2 h session in a novel environment was enhanced in Grin2aS/S mice. b Similarly, the exploratory behavior of Grin2aS/S mice remained high in all three successive 6 min exposure sessions to five novel objects (ITI = 4 min), as exemplified by traces of the animal’s movement on the right. c (left) The time of first fall (Cliff Avoidance Reflex, CAR) was significantly reduced for Grin2aS/S and Grin2a+/S mice. c (right) In a 60-min session Grin2aS/S mice showed a significantly increased number of falls compared to wild-type mice. d (left) In the three-chamber sociability test Grin2aS/S mutants had a significantly reduced preference to explore the stimulus mouse over the object compared to Grin2a+/S and Grin2a+/+ littermates. d (right) Occupancy heat maps in the three-chamber sociability test show a representative example of a Grin2aS/S mouse with a reduced preference for another mouse versus an inanimate object. The social preference is visible for Grin2a+/+ and Grin2a+/S mice. The occupancy is color-coded separately for each group and translates to a % given in white numbers on the key for each genotype. e During the novel object recognition test, Grin2aS/S mice displayed significantly more interactions with the two objects in both the sample and test runs compared to their Grin2a+/S and Grin2a+/+ littermates. During the test run, only the Grin2a+/S and Grin2a+/+ showed a significant preference for the novel object over the familiar object. There was no significant novelty preference in the Grin2aS/S mice. f During the sample run in the Y-maze Grin2aS/S mice made significantly more total arm entries. In the test run, Grin2a+/+ and Grins2a+/S showed a preference for the unexplored novel Y-maze arm, whereas Grin2aS/S mice showed a lack of novelty preference. The numbers of mice are shown in brackets or below the bars of bar graphs. Chance levels (Ch.) are indicated by dashed lines. Error bars represent mean ± SEM (for statistics: Supplementary Statistics to Fig. 7).
Fig. 8
Fig. 8. Associative learning in GluN2A(N615S) expressing mice.
a Odor discrimination. Grin2aS/S learned to discriminate between amyl acetate and ethyl butyrate in a rewarded go/no go-paradigm (250 trials for each odor stimulus, pseudo-randomized, and counterbalanced by stimulus identity across animals). Acquisition was similar for all three genotypes. b Simple visuo-tactile discrimination. Grin2aS/S mutant mice showed normal acquisition in the simple discrimination T-maze task and were able to associate a specific visuo-tactile insert (black foam versus light blue toweling) with a milk reward. c Morris watermaze. In the standard Morris watermaze task (left graph) the path length to reach the hidden platform decreased across training blocks for Grin2a+/+ and Grin2a+/S mice but not for Grin2aS/S mice. Two probe trials were conducted after 12 and 24 training trials (P1 and P2, respectively) during which the platform was removed from the pool. At both P1 and P2 (right bar graphs) the Grin2aS/S mice failed to search for the platform in the target quadrant. AdjL adjacent left, Target fixed location of the hidden escape platform during acquisition, AdjR adjacent right, Opp opposite of target quadrant. Dashed lines indicate chance levels. d Rewarded alternation. (left) In the T-maze rewarded alternation task (right) spatial working memory performance was substantially impaired in Grin2aS/S mice. e Contiguous task. In the contiguous version of the conditional T-maze task (with floor inserts covering the entire T-maze; white Perspex versus gray wire mesh), Grin2a+/+ and Grin2aS/S mice were able to associate a particular floor insert with the location of the reward in either the left or the right goal arm. f Discontiguous task. Separate groups of mice were trained in the discontiguous version of this conditional task, in which the floor insert cues were now limited to the start arm only. Grin2a+/+ mice readily acquired the task, but Grin2aS/S mice failed to learn. The numbers of mice are shown in brackets or below the bars of bar graphs. Chance levels (Ch.) are indicated by dashed lines. Error bars represent mean ± SEM (for statistics: Supplementary Statistics to Fig. 8).

References

    1. Matta JA, et al. Developmental origin dictates interneuron AMPA and NMDA receptor subunit composition and plasticity. Nat. Neurosci. 2013;16:1032–1041. doi: 10.1038/nn.3459. - DOI - PMC - PubMed
    1. Hofer, M. & Constantine-Paton, M. in Progress in Brain Research Vol. 102 (eds. Van Pelt, J., Corner, M. A., Uylings, H. B. M. & Lopes Da Silva, F. H.) 277–285 (Elsevier, 1994).
    1. Fox K, Daw NW. Do NMDA receptors have a critical function in visual cortical plasticity? Trends Neurosci. 1993;16:116–122. doi: 10.1016/0166-2236(93)90136-A. - DOI - PubMed
    1. Constantine-Paton M. NMDA receptor as a mediator of activity-dependent synaptogenesis in the developing brain. Cold Spring Harb. Symp. Quant. Biol. 1990;55:431–443. doi: 10.1101/SQB.1990.055.01.043. - DOI - PubMed
    1. Chittajallu R, et al. Afferent specific role of NMDA receptors for the circuit integration of hippocampal neurogliaform cells. Nat. Commun. 2017;8:152. doi: 10.1038/s41467-017-00218-y. - DOI - PMC - PubMed

Publication types

MeSH terms

Substances