

A unified framework for herbivore-to-producer biomass ratio reveals the relative influence of four ecological factors
- PMID: 33420411
- PMCID: PMC7794211
- DOI: 10.1038/s42003-020-01587-9
A unified framework for herbivore-to-producer biomass ratio reveals the relative influence of four ecological factors
Abstract
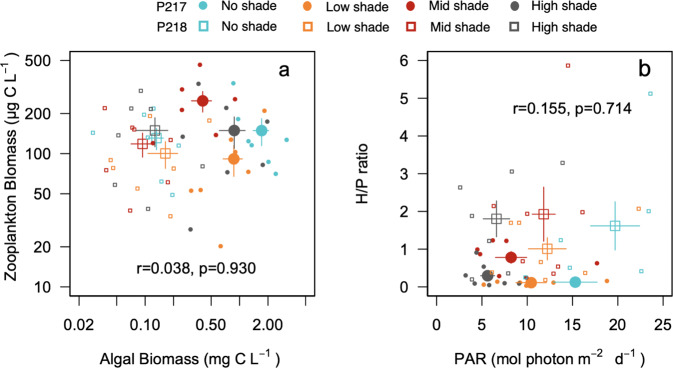
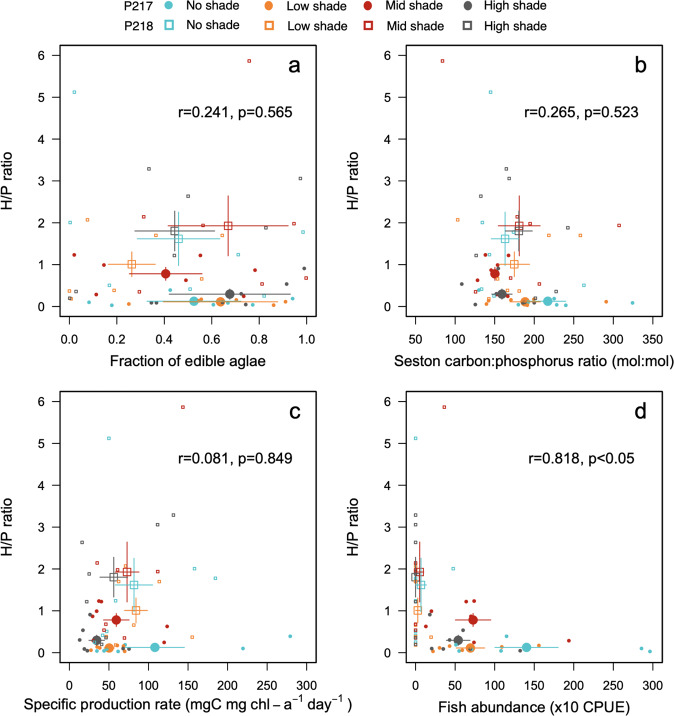
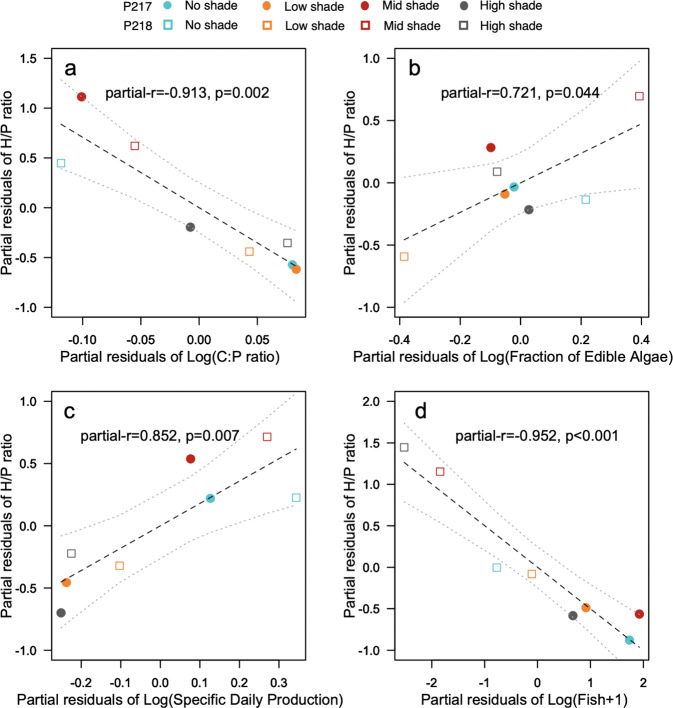
The biomass ratio of herbivores to primary producers reflects the structure of a community. Four primary factors have been proposed to affect this ratio, including production rate, defense traits and nutrient contents of producers, and predation by carnivores. However, identifying the joint effects of these factors across natural communities has been elusive, in part because of the lack of a framework for examining their effects simultaneously. Here, we develop a framework based on Lotka-Volterra equations for examining the effects of these factors on the biomass ratio. We then utilize it to test if these factors simultaneously affect the biomass ratio of freshwater plankton communities. We found that all four factors contributed significantly to the biomass ratio, with carnivore abundance having the greatest effect, followed by producer stoichiometric nutrient content. Thus, the present framework should be useful for examining the multiple factors shaping various types of communities, both aquatic and terrestrial.
Conflict of interest statement
The authors declare no competing interests.
Figures

Similar articles
-
A cross-system synthesis of consumer and nutrient resource control on producer biomass.Ecol Lett. 2008 Jul;11(7):740-55. doi: 10.1111/j.1461-0248.2008.01192.x. Epub 2008 Apr 25. Ecol Lett. 2008. PMID: 18445030 Review.
-
Herbivore regulation of plant abundance in aquatic ecosystems.Biol Rev Camb Philos Soc. 2017 May;92(2):1128-1141. doi: 10.1111/brv.12272. Epub 2016 Apr 8. Biol Rev Camb Philos Soc. 2017. PMID: 27062094 Review.
-
Herbivore vs. nutrient control of marine primary producers: context-dependent effects.Ecology. 2006 Dec;87(12):3128-39. doi: 10.1890/0012-9658(2006)87[3128:hvncom]2.0.co;2. Ecology. 2006. PMID: 17249237
-
Enrichment scale determines herbivore control of primary producers.Oecologia. 2016 Mar;180(3):833-40. doi: 10.1007/s00442-015-3505-1. Epub 2015 Nov 14. Oecologia. 2016. PMID: 26572636
-
Complex food webs prevent competitive exclusion among producer species.Proc Biol Sci. 2008 Nov 7;275(1650):2507-14. doi: 10.1098/rspb.2008.0718. Proc Biol Sci. 2008. PMID: 18647714 Free PMC article.
References
-
- Odum, E. P., & Barrett, G. W. Fundamentals of ecology (Vol. 3). (Saunders, Philadelphia, 1971).
-
- Hairston NG, Jr, Hairston Sr NG. Cause-effect relationships in energy flow, trophic structure, and interspecific interactions. Am. Nat. 1993;142:379–411. doi: 10.1086/285546. - DOI
-
- Sterner, R. W. & Elser, J. J., 2002. Ecological stoichiometry: the biology of elements from molecules to the biosphere. Princeton University Press, Princeton, NJ, 2002).
Publication types
MeSH terms
Associated data
LinkOut - more resources
Full Text Sources
Other Literature Sources
