. 2021 Jan 8;4(1):55.
doi: 10.1038/s42003-020-01568-y.

An electron transfer competent structural ensemble of membrane-bound cytochrome P450 1A1 and cytochrome P450 oxidoreductase

Affiliations

An electron transfer competent structural ensemble of membrane-bound cytochrome P450 1A1 and cytochrome P450 oxidoreductase

Goutam Mukherjee et al. Commun Biol. .

Abstract

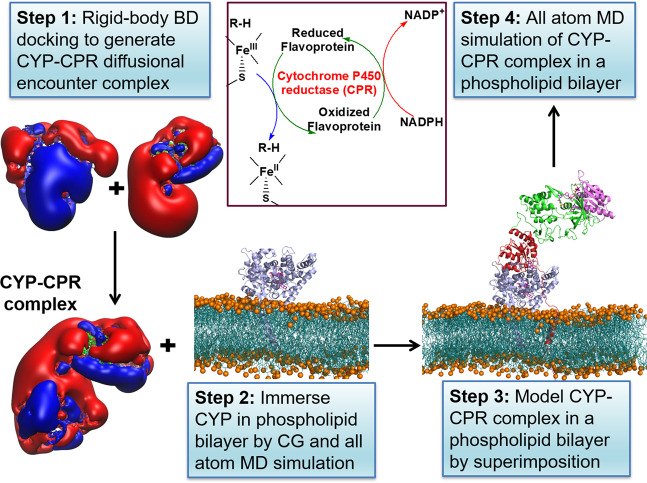
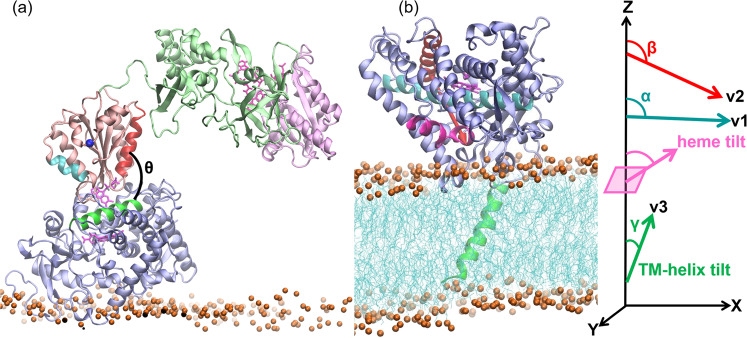
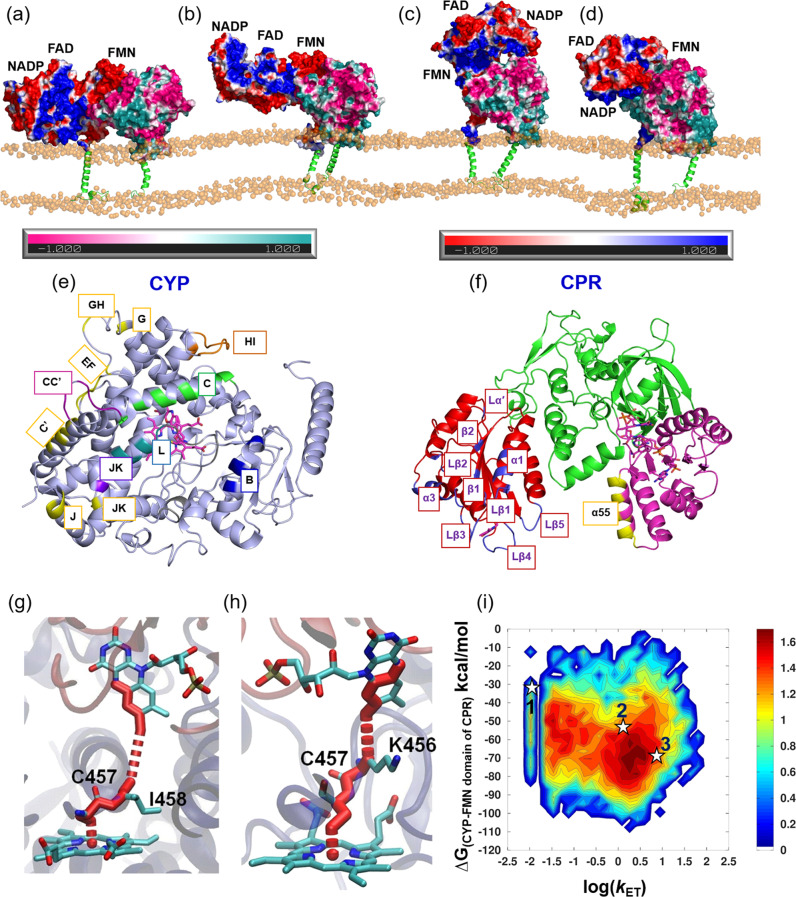
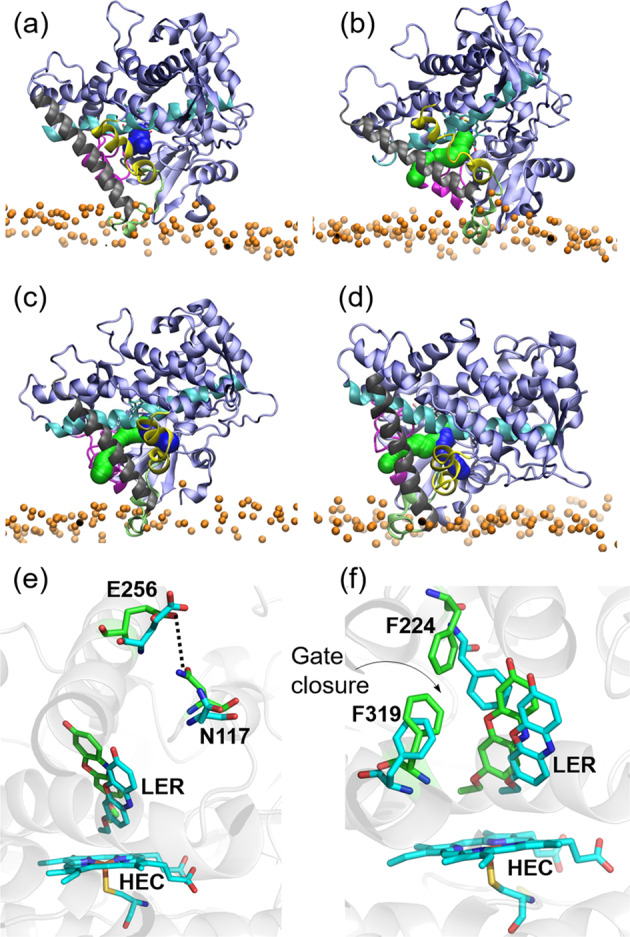
Cytochrome P450 (CYP) heme monooxygenases require two electrons for their catalytic cycle. For mammalian microsomal CYPs, key enzymes for xenobiotic metabolism and steroidogenesis and important drug targets and biocatalysts, the electrons are transferred by NADPH-cytochrome P450 oxidoreductase (CPR). No structure of a mammalian CYP-CPR complex has been solved experimentally, hindering understanding of the determinants of electron transfer (ET), which is often rate-limiting for CYP reactions. Here, we investigated the interactions between membrane-bound CYP 1A1, an antitumor drug target, and CPR by a multiresolution computational approach. We find that upon binding to CPR, the CYP 1A1 catalytic domain becomes less embedded in the membrane and reorients, indicating that CPR may affect ligand passage to the CYP active site. Despite the constraints imposed by membrane binding, we identify several arrangements of CPR around CYP 1A1 that are compatible with ET. In the complexes, the interactions of the CPR FMN domain with the proximal side of CYP 1A1 are supplemented by more transient interactions of the CPR NADP domain with the distal side of CYP 1A1. Computed ET rates and pathways agree well with available experimental data and suggest why the CYP-CPR ET rates are low compared to those of soluble bacterial CYPs.


Conflict of interest statement

The authors declare no competing interests.

Figures

Fig. 1
Fig. 1. Diagram of the procedure to build and simulate a model of a mammalian CYP–CPR complex in a membrane.
The formation of the CYP–CPR complex is necessary for the transfer of electrons to the CYP active site in the CYP catalytic cycle, as indicated in the schematic cycle. Step 1: Brownian dynamics (BD) rigid-body docking of CYP and CPR globular domains. Molecular electrostatic isopotential contours at ±1 kT/e show a highly positive (blue) patch on the proximal face of CYP and a highly negative (red) patch on the CPR that interact complementarily in the docked complexes. Step 2: Coarse-grained (CG) and all-atom molecular dynamics (MD) simulation of CYP (blue cartoon representation) in a phospholipid bilayer (cyan with orange spheres representing phosphorous atoms). Step 3: Relaxation of the BD docked complexes by MD simulation in aqueous solution followed by superimposition on the CYP in the bilayer (with CPR shown in cartoon representation colored by the domain (FMN: red, FAD: green, NAD: pink)). Step 4: Atomic detail MD simulation of the CYP–CPR complexes in a phospholipid bilayer.
Fig. 2
Fig. 2. A CYP 1A1–CPR encounter complex obtained from the rigid-body BD docking simulations is shown superimposed on the structure of CYP 1A1 in a membrane bilayer obtained from MD simulations, which is shown together with the definitions of the angles defining the arrangement of the proteins.
A CYP 1A1–CPR encounter complex (D2) obtained from the rigid-body BD docking simulations is shown in a superimposed on the structure of CYP 1A1 in a membrane bilayer obtained from MD simulations shown in b. The proteins are shown in cartoon representation (CYP globular domain: lilac, TM-helix: green; CPR FMN domain: salmon, FAD domain: pale green, NADP domain: pale pink), cofactors are shown in pink stick representation, and the bilayer is shown in cyan lines with orange spheres representing the phosphorous atoms. The angles defining the arrangement of the proteins are shown: θ is the angle between the CYP C-helix (green) and the FMN domain α1-helix (residues 91–105; red); the FMN domain α3-helix (150–158; cyan) and N-terminal residue of FMN domain (blue sphere) are indicated; the heme-tilt angle is the angle between the heme plane and the z axis perpendicular to the membrane plane; α, β, and γ are the angles between the z axis and the vectors v1, along the I-helix (cyan), v2, orthogonal to v1 and connecting the C-helix (red) and the F-helix (magenta); and v3 along the TM-helix (residues 7–26; green).
Fig. 3
Fig. 3. Evolution of the six CYP–FMN domain encounter complexes generated by BD rigid-body docking during the MD simulations in aqueous solution (referred to as ‘soluble’ simulations).
Cα atom root mean squared deviation (Cα-RMSD) of a the globular domain of CYP 1A1, b the FMN domain of CPR, and c the FMN domain when the CYP domains of the complex were superimposed with respect to the initial frame. d Center-to-center distance between the CYP and the FMN domain, DCYP-FMN domain, and e the distance between the HEME:Fe and FMN:N5 atoms, DFe-N5. RMSDs were calculated with respect to the initial energy minimized encounter complexes generated by BD simulation. Color scheme: A4: Black; B7: Red; C2: Green; C3: Blue; D2: yellow; D3: Brown.
Fig. 4
Fig. 4. Observed changes in the position and configuration of the CYP–CPR complexes in the phospholipid bilayer during MD simulations.
ac Angles defining the CYP orientation in the membrane: a α, b β, and c heme-tilt; d center of mass (CoM) distance of the FG loop to the CoM of the membrane, DFG-mem; e the redox center separation distance, DFe-N5; fh CoM distances between f CYP and FMN domains, DCYP-FMN domain g CYP and NADP domains, DCYP-NADP domain and h FAD and NADP domains, DFAD-NADP domain. The lengths of the simulations for C2 (black), C3 (red), D2 (green), and D2′ (blue) were 478, 585, 524, and 568 ns, respectively.
Fig. 5
Fig. 5. Structures, interactions, and predicted ET pathways of four CYP–CPR complexes in a POPC bilayer obtained from MD simulations.
a C-2, b C3, c D2, and d D2′. The proteins are shown in surface representation colored by electrostatic potential (positive: CYP (cyan) and CPR (blue); negative: CYP (pink) and CPR (red)) with the transmembrane helices in green cartoon representation and the phosphorous atoms of the lipids represented as orange spheres. e, f The interfaces in the model CYP 1A1–CPR complexes are highlighted by colors and labels on cartoon representations of e CYP 1A1 (light blue) and f CPR (with the FMN domain (red), the FAD domain (green) and the NADP domain (pink)); CYP interface colors: B-Helix: Blue; C-Helix: Green; CC′-Loop: Purple; JK-Loop: Violet; HI-Loop and I-Helix: Orange; Loop near HEME: Gray; L-Helix: Deep teal; NADP binding region: Yellow. The FMN domain interface is colored blue and the NADP domain interface is colored yellow. The interfacial residues are listed in Supplementary Table S2. gi Predicted ET pathways from the N5 of the FMN cofactor of CPR to Fe of the CYP 1A1 heme cofactor in complexes from g C3, D2, and h D2′ simulations; i 2D-histogram plot of the computed free energy of formation of the CYP-FMN domain complex vs predicted log(kET) rates. Stars indicate complexes from the last frames of the simulations (1) C3, (2) D2, and (3) D2′ for which atomic coordinates are provided in ModelArchive.
Fig. 6
Fig. 6. Comparison of the CYP catalytic domain–FMN domain interaction in the final CYP 1A1–CPR complex from the D2′ simulation with the crystal structure of P450BM3.
The cofactors approach more closely in the CYP 1A1–CPR complex and the angle θ between the FMN domain α1 helix and the CYP C-helix differs by 20°. a Overlay of the structures by superposition of the heme cofactors. DFe-N5 is 16.3 Å in the CYP1A1–CPR complex and 23.5 Å in P450BM3. Close-up views of b the simulated CYP1A1–CPR complex and c the crystal structure of P450BM3. Salt-bridges between R136 of CYP 1A1 and residues E92 and E93 of the CPR FMN domain, as well as R135 with a heme carboxylate, lock the arrangement of the FMN domain α1-helix and the CYP C-helix. In contrast, in P450BM3, Dubey et al. found that after MD simulation, the α1-helix reoriented and E494 lost its hydrogen bond to H100 and approached K97 of P450BM3, located at the beginning of the C-helix, close enough to form a salt-bridge. This reorganization resulted in a change from a perpendicular to a parallel arrangement of the C- and α1-helices. CYP 1A1, however, lacks a corresponding positively charged residue at the N terminus of the C-helix: P129, A132, and R135 of the C-helix of CYP 1A1 structurally align with K94, K97, and H100 of P450BM3, respectively. Color scheme: P450BM3 FMN and CYP domains: white; CPR FMN and CYP 1A1 globular domains: salmon and light blue, respectively; CYP C-helices: green; FMN domain α1 helices of P450BM3 and CPR: pink and red, respectively; FMN cofactors: pink, with P450BM3 and CPR cofactors in licorice and ball-and-stick representation, respectively; HEME: magenta carbons; 7-ethoxyresorufin: orange; selected residues are shown in yellow carbon representation with hydrogen bonds indicated by black dashed lines.
Fig. 7
Fig. 7. Comparison of ligand tunnels from the active site to the surface of CYP 1A1 in MD simulations of membrane-bound CYP 1A1–CPR complexes and of the CPR-free membrane-anchored-CYP 1A1.
ad Tunnels calculated by CAVER analysis for ac three CYP–CPR simulations: a C3; b D2 c D2′; and d CYP 1A1 simulated in a membrane in the absence of CPR. (Color scheme: BC-Loop (105–128): Magenta; F-Helix (211–228): Yellow; FG-Loop (229–245): lime; G-Helix (246–272): Gray; I-Helix (304–336): Cyan. Tunnel 2ac: green; solvent tunnel: blue.) e, f Changes in the active site of CYP 1A1 during simulations of the CYP–CPR complexes in the membrane bilayer resulting in closure of ligand tunnels. Structures are shown before (cyan) and after (green) simulation. e Formation of a hydrogen bond with 95% occupancy between the side chains of N117 and E256 in the C3 simulation blocking tunnel 2ac. The occupancy of this interaction during the other simulations was <30%. f Movement of F224 and F319 in the I-helix in the D2 simulation to make van der Waals contact with an occupancy of 56%, thus blocking the route for ligand passage through the solvent tunnel. In the other simulations, the interaction between F224 and F319 was absent. Instead, there were parallel π–π interactions between the ligand and F224.

Similar articles

Cited by

References

    1. Kumar S. Engineering cytochrome P450 biocatalysts for biotechnology, medicine and bioremediation. Expert Opin. Drug Metab. Toxicol. 2010;6:115–131. doi: 10.1517/17425250903431040. - DOI - PMC - PubMed
    1. Ortiz de Montellano, P. R. in Cytochrome P450: Structure, Mechanism, and Biochemistry (ed. Ortiz de Montellano, P. R.) 111–176 (Springer International Publishing, 2015).
    1. Mustafa, G., Yu, X. & Wade, R. C. in Drug Metabolism Prediction Vol. 38 (ed. Kirchmair, J.) 75–102 (Wiley‐VCH Verlag GmbH & Co. KGaA., 2014).
    1. Kirchmair J, et al. How do metabolites differ from their parent molecules and how are they excreted? J. Chem. Inf. Model. 2013;53:354–367. doi: 10.1021/ci300487z. - DOI - PubMed
    1. Guengerich FP. Mechanisms of cytochrome P450 substrate oxidation: MiniReview. J. Biochem. Mol. Toxicol. 2007;21:163–168. doi: 10.1002/jbt.20174. - DOI - PubMed

Publication types

MeSH terms

LinkOut - more resources