. 2021 Apr;83(3):1312-1328.
doi: 10.3758/s13414-020-02174-0. Epub 2021 Jan 8.

Perceiving ensemble statistics of novel image sets

Affiliations

Perceiving ensemble statistics of novel image sets

Noam Khayat et al. Atten Percept Psychophys. 2021 Apr.

Abstract

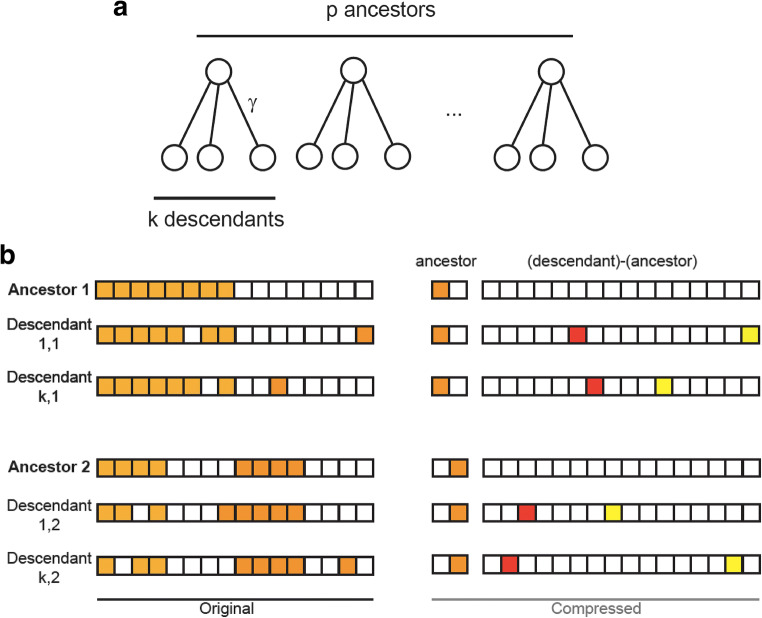
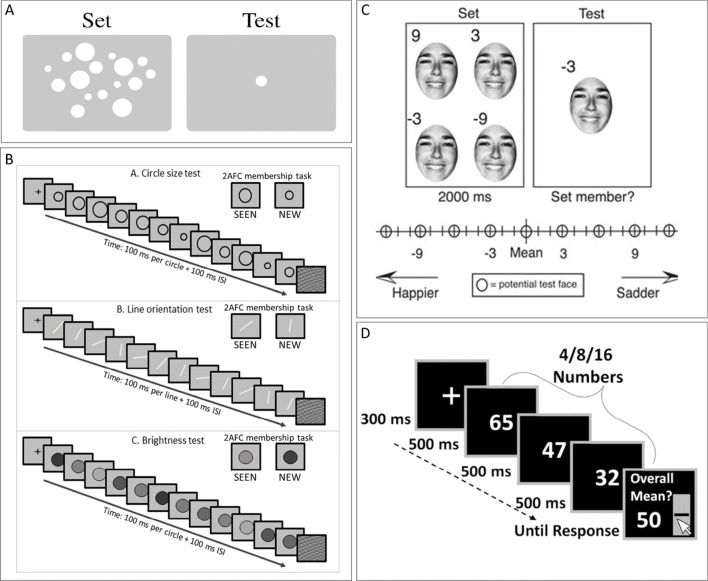
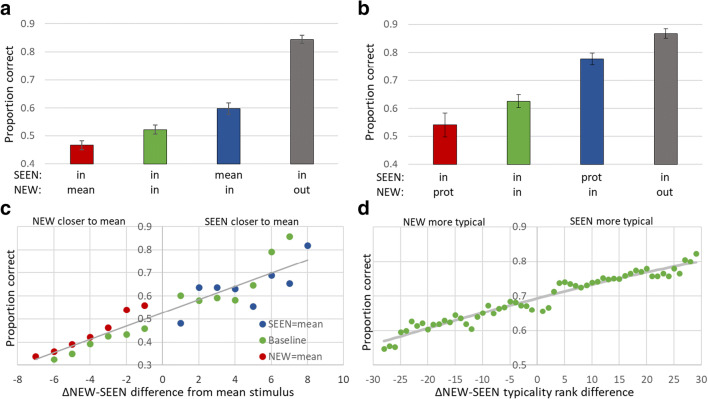
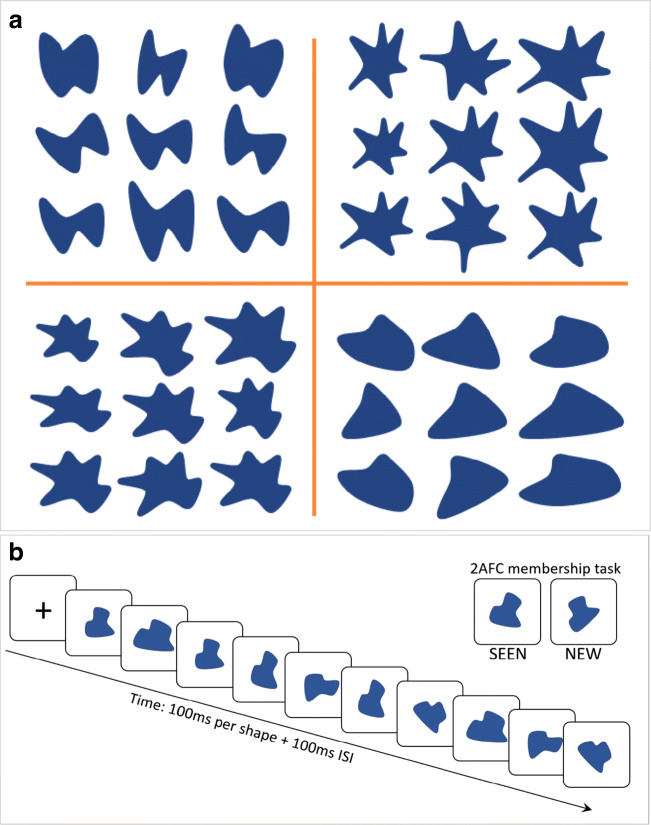
Perception, representation, and memory of ensemble statistics has attracted growing interest. Studies found that, at different abstraction levels, the brain represents similar items as unified percepts. We found that global ensemble perception is automatic and unconscious, affecting later perceptual judgments regarding individual member items. Implicit effects of set mean and range for low-level feature ensembles (size, orientation, brightness) were replicated for high-level category objects. This similarity suggests that analogous mechanisms underlie these extreme levels of abstraction. Here, we bridge the span between visual features and semantic object categories using the identical implicit perception experimental paradigm for intermediate novel visual-shape categories, constructing ensemble exemplars by introducing systematic variations of a central category base or ancestor. In five experiments, with different item variability, we test automatic representation of ensemble category characteristics and its effect on a subsequent memory task. Results show that observer representation of ensembles includes the group's central shape, category ancestor (progenitor), or group mean. Observers also easily reject memory of shapes belonging to different categories, i.e. originating from different ancestors. We conclude that complex categories, like simple visual form ensembles, are represented in terms of statistics including a central object, as well as category boundaries. We refer to the model proposed by Benna and Fusi (bioRxiv 624239, 2019) that memory representation is compressed when related elements are represented by identifying their ancestor and each one's difference from it. We suggest that ensemble mean perception, like category prototype extraction, might reflect employment at different representation levels of an essential, general representation mechanism.

Keywords: Categorization; Ensemble Perception; Implicit/explicit memory; Visual perception.


Figures

Fig. 1
Fig. 1
Storing correlated patterns. (a) Schematic representation of an ultra-metric tree with p ancestors and k descendants per ancestor used to generate correlated patterns. (b) Possible scheme using correlations to generate compressed representations that are sparse and more efficiently storable. From Benna and Fusi (2019)
Fig. 2
Fig. 2
Previous study stimulus sets. (A) Ariely’s (2001) schematic representation of the two intervals used in his experiment’s trials. Observers were exposed for 500 ms to a set of spatially dispersed circles differing by size and then asked if a test stimulus size had been present in the set, or is smaller/larger than the set mean. (B) Khayat and Hochstein’s (2018) RSVP sequences consisted of 12 elements, each presented for 100 ms plus a 100-ms inter-stimulus interval (ISI), followed by a two-alternative forced-choice (2-AFC) membership test (i.e., which test element had been present in the sequence). Blocks contained circles differing in size, lines differing in orientation, or discs differing in brightness. Observers were asked which of two test elements was present in the set. They were unaware that either test element could equal the set mean or the nonmember could be outside the set range. (C) Haberman and Whitney’s (2009) task included four faces (from a set of 4, 8, 12, or 16), differing in facial emotional expression, presented for 2 s. Observers then indicated whether the test face was a member of the set, or was happier/sadder than the set mean. (D) Brezis et al.’s (2015) trials consisted of two-digit numbers sequentially presented at a rate of 500 ms/stimulus. Set size was 4, 8, or 16. Participants estimated set average
Fig. 3
Fig. 3
Low-level parameter mean perception (a, c) compared to category prototype perception (b, d). Participants viewed a sequence of images varying in a low-level parameter (Fig. 1b), i.e., circle size, line orientation, or disc brightness (a, c), or a sequence of object images from a single category (b, d), followed by two test images, one SEEN in the sequence and one NEW. They were asked to choose the SEEN image. Participants had difficulty remembering sequence images. Instead, the SEEN (graph blue bar) or NEW (red) image that matched the mean or category prototype was preferred, relative to the case where neither test image matched the mean or prototype (green) and a NEW image from outside the range or from a different category was rejected (black). See text. From Khayat and Hochstein (2018, 2019a). This preference was graded in that the closer the test image to the mean (c) or the greater its category typicality (d), the greater the chance of its being chosen as SEEN, as measured by probability of choice dependence on the difference between the test images’ distance from the mean (c) or difference in their typicality (d). prot = prototypical object image, in = in range, out = out of range, mean = ensemble mean. Error bars in all figures indicate standard error of the mean. Differences in mean accuracy between all pairs of trial subtypes in both low-level and categorization studies were significant, p < 0.05
Fig. 4
Fig. 4
(a) Examples of random amoeba shapes for Experiment 1. The central image is the ancestor and the surrounding eight images are descendants, created by applying distortions to the ancestor, enlarging or compressing, rotating, stretching, or shrinking. (b) Trial design. RSVP sequences of ten elements, followed by a two-alternative forced-choice (2-AFC) membership test, asking which test element had been present in the sequence
Fig. 5
Fig. 5
Experiment 1 – random amoeba images. (a) Perception and memory of the ancestor, whether present (blue) or absent (red) steers performance above or below baseline (green), respectively. Rejecting images from another ancestor improves performance dramatically (grey). Thus, participants clearly perceive the amoeba forms as a set with a definite ancestor image from which they descend. Differences in mean accuracy between each two trial subtypes were significant (p < 0.001). (b) Reaction time (RT) for different trial subtypes, for correct (green) and incorrect (red) responses, for each trial type
Fig. 6
Fig. 6
Constructing ancestor and descendants of star-like Amoeba shapes. (a) Equidistant symmetric star-like shapes defined by number of corners, p, across; inner:outer vertex radius ratio, IR:OR, down; and sharpness-roundness level, within each square. (b) Examples of ancestors, constructed from symmetric star-like shapes by general rotation; rotating local outer vertices individually; and shifting local vertex radii inward or outward (decreasing and increasing them, respectively). (c) Illustration of ancestor modification for Experiment 2, creating its descendants by increasing or decreasing local Inner or outer vertex radii, respectively, general rotation and/or local vertex point rotation. (d) Illustration of Experiment 2 trial paradigm: RSVP (100 ms/shape + 100-ms ISI; up to two changes/stimulus) followed by a two-alternative forced-choice (2-AFC) membership task
Fig. 7
Fig. 7
Experiment 2. (a) Accuracy of membership task performance for the different trial subtypes, illustrating implicit statistical effects of mean (dark blue and red bars vs. baseline green bar), base (light blue and pink vs. green) and range effect (grey vs. green). (b) Correct (green) and Incorrect (red) response RTs for each subtype, illustrating absence of speed-accuracy trade-off
Fig. 8
Fig. 8
Trial examples for Experiments 3–5. Paradigm like Experiments 1–2, with RSVP sequence (100 ms/shape + 100-ms ISI) followed by a two-alternative forced-choice (2-AFC) membership test. (a) Experiment 3. One change/stimulus from the possible three: general rotation, local point rotation, local radius change (IR increase or OR decrease). (b) Experiment 4. Descendants created only by local radius changes (IR increase or OR decrease). (c) Experiment 5. Symmetric changes for each two descendants included in the RSVP sequence, so that the sequence mean equals the ancestor base. Only local radius changes (IR increase/decrease; OR increase/decrease). In Experiment 5, trials where the ancestor was a sequence member, RSVP had nine stimuli; where not a member, RSVP had eight stimuli
Fig. 9
Fig. 9
Experiment 3. (a) Accuracy of membership task performance for the different trial subtypes, illustrating implicit statistical effects of mean (dark blue-red bars), base (light blue-pink bars) and range effect (green-grey bars). (b) Correct and Incorrect reaction times (RTs) for each subtype illustrating no speed-accuracy trade-off (green=correct choices, red=incorrect choices)
Fig. 10
Fig. 10
Relative contribution of each feature modification to mean and base effects. The contributions were evaluated by a measurement of both mean and base effects (subtraction of trials wherein mean/base were SEEN shapes from trials where mean/base were NEW shapes in the two-alternative forced-choice (2-AFC) membership tasks). These effects were calculated separately for each feature modification of the NEW and SEEN shapes and plotted here
Fig. 11
Fig. 11
Experiment 4. (a) Accuracy of membership task performance for different trial subtypes, illustrating implicit statistical effects of mean (dark blue-red bars), base (light blue-pink), and range effect (grey) compared to baseline (dark green). (b) Reaction times (RTs) for trials with correct (light green) and incorrect (red) responses for each subtype illustrating lack of speed-accuracy trade-off. (c) Graded base effect. (d) Graded mean effect. X-axis in C and D is calculated difference between distances of the two test shapes from base or mean, respectively. Negative values represent trials where NEW is closer to mean or base, positive values where SEEN is more like mean or base. Dot colors represent trial subtypes as in (a)
Fig. 12
Fig. 12
Experiment 5. (a) Accuracy of membership task performance for the different trial subtypes, illustrating implicit statistical effects of ancestor (dark blue-red bars) and range effect (grey-green bars). Difference is highly significant (p < 0.001) in both. (b) Correct (green) and Incorrect (red) trial reaction times (RTs) for each subtype illustrating no speed-accuracy trade-off, and a flip between speed of correct and incorrect responses between trials of NEW = base and baseline to SEEN = base and NEW = out. (c) Graded ancestor effect: X-axis as in Fig. 11c and d; dot colors represent trial subtypes as in (a)

Similar articles

Cited by

References

    1. Allik J, Toom M, Raidvee A, Averin K, Kreegipuu K. Obligatory averaging in mean size perception. Vision Research. 2014;101:34–40. - PubMed
    1. Alvarez GA, Oliva A. The representation of simple ensemble visual features outside the focus of attention. Psychological Science. 2008;19(4):392–398. doi: 10.1111/j.1467-9280.2008.02098.x. - DOI - PMC - PubMed
    1. Alvarez GA, Oliva A. Spatial ensemble statistics are efficient codes that can be represented with reduced attention. Proceedings of the National Academy of Sciences of the United States of America. 2009;106(18):7345–7350. doi: 10.1073/pnas.0808981106. - DOI - PMC - PubMed
    1. Ariely D. Seeing sets: Representation by statistical properties. Psychological Science. 2001;12(2):157–162. - PubMed
    1. Ashby FG, Maddox WT. A response time theory of separability and integrality in speeded classification. Journal of Mathematical Psychology. 1994;38:423–466. doi: 10.1006/jmps.1994.1032. - DOI

LinkOut - more resources