

Origin of translational control by eIF2α phosphorylation: insights from genome-wide translational profiling studies in fission yeast
- PMID: 33420908
- PMCID: PMC8140999
- DOI: 10.1007/s00294-020-01149-w
Origin of translational control by eIF2α phosphorylation: insights from genome-wide translational profiling studies in fission yeast
Abstract
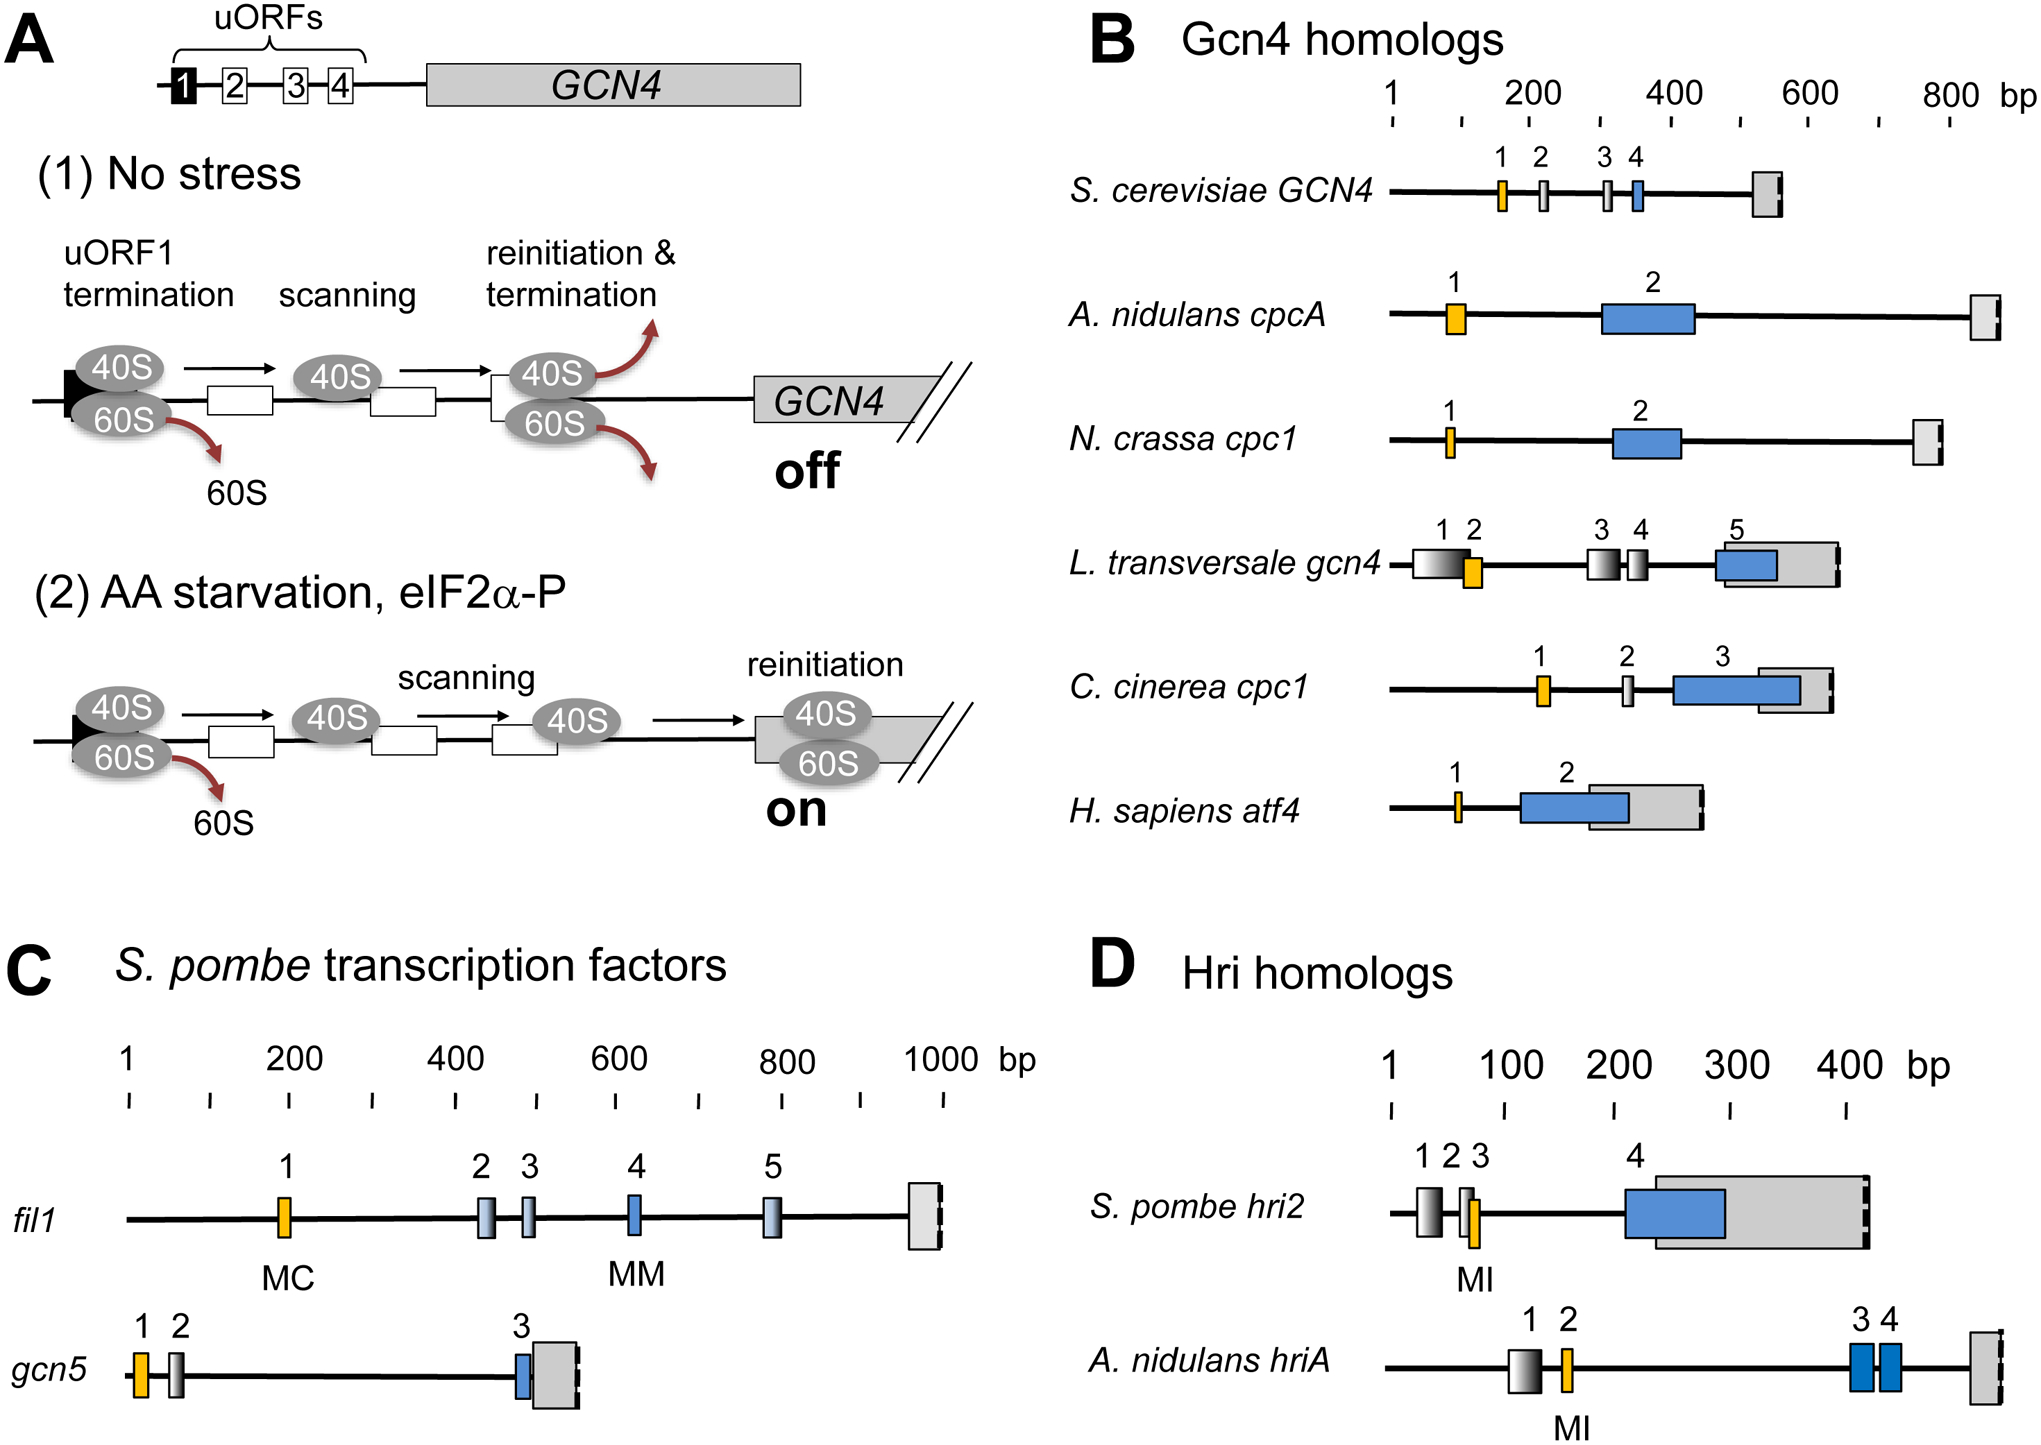
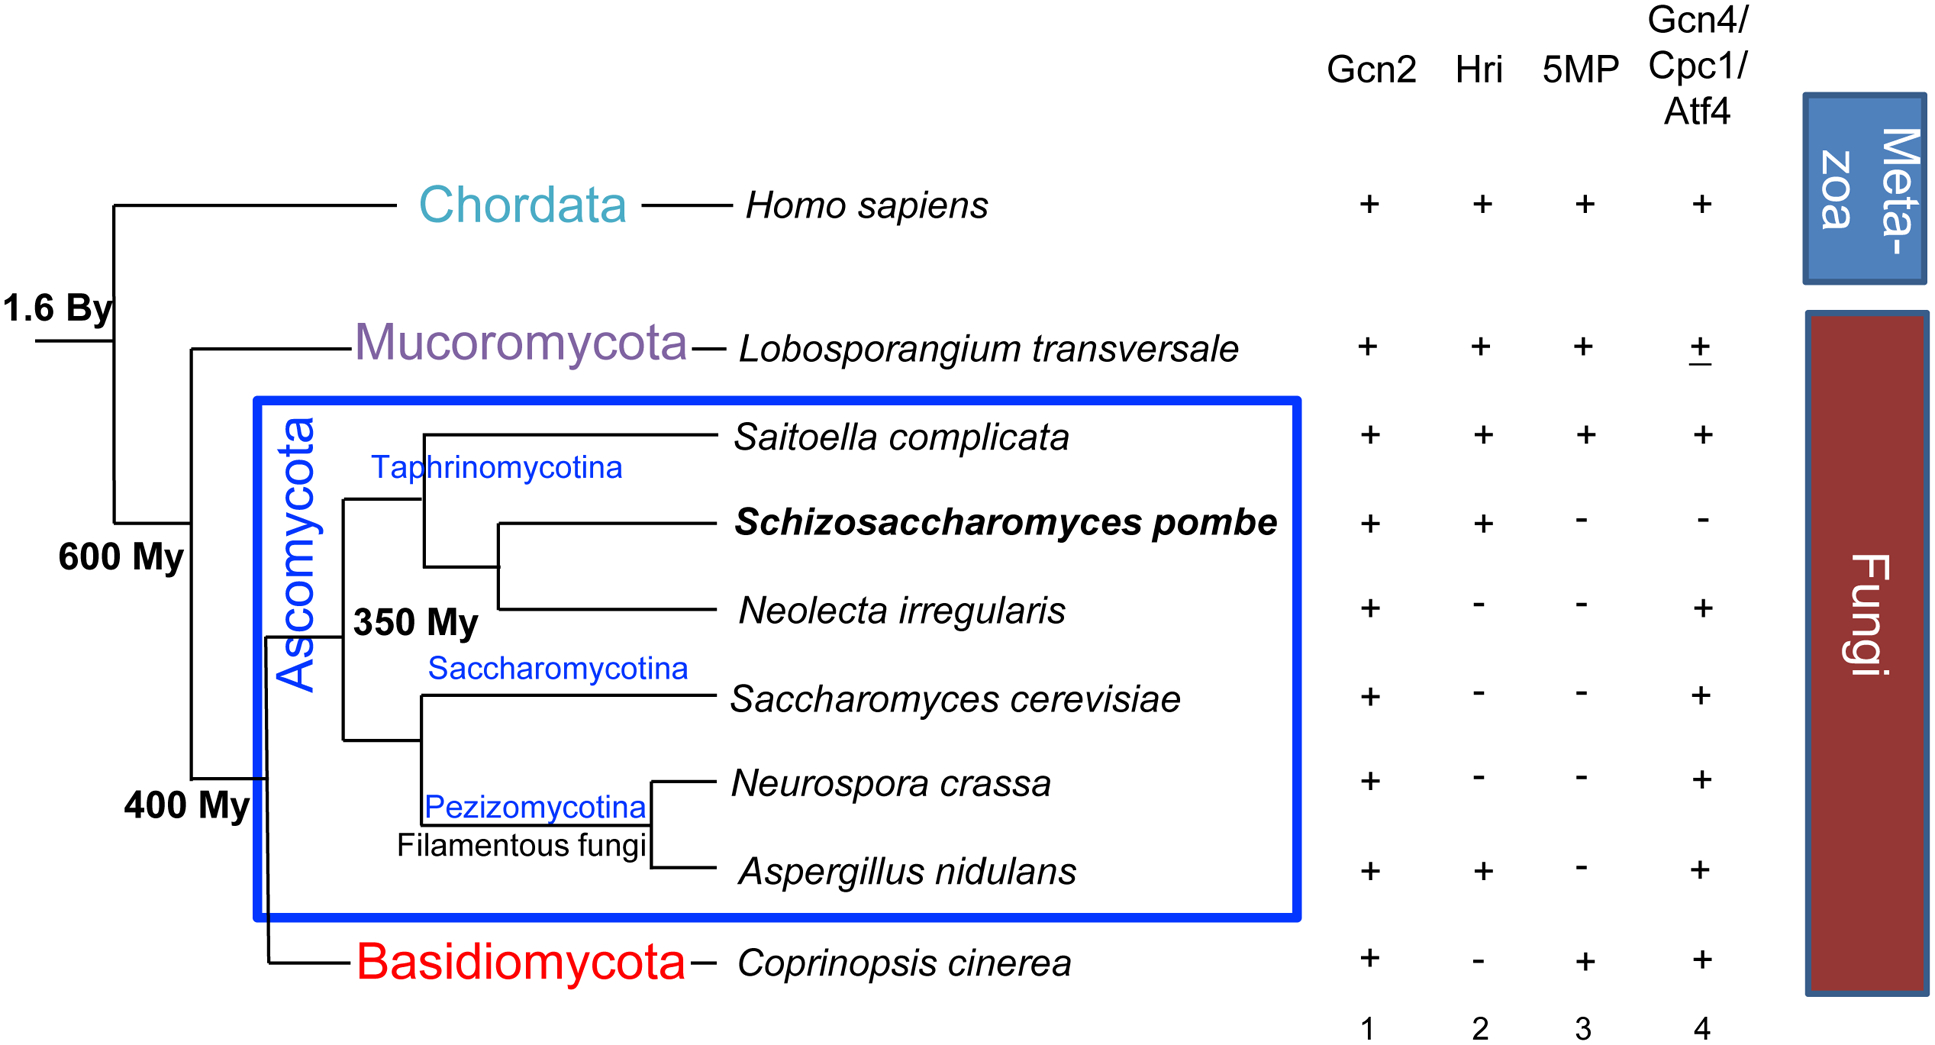
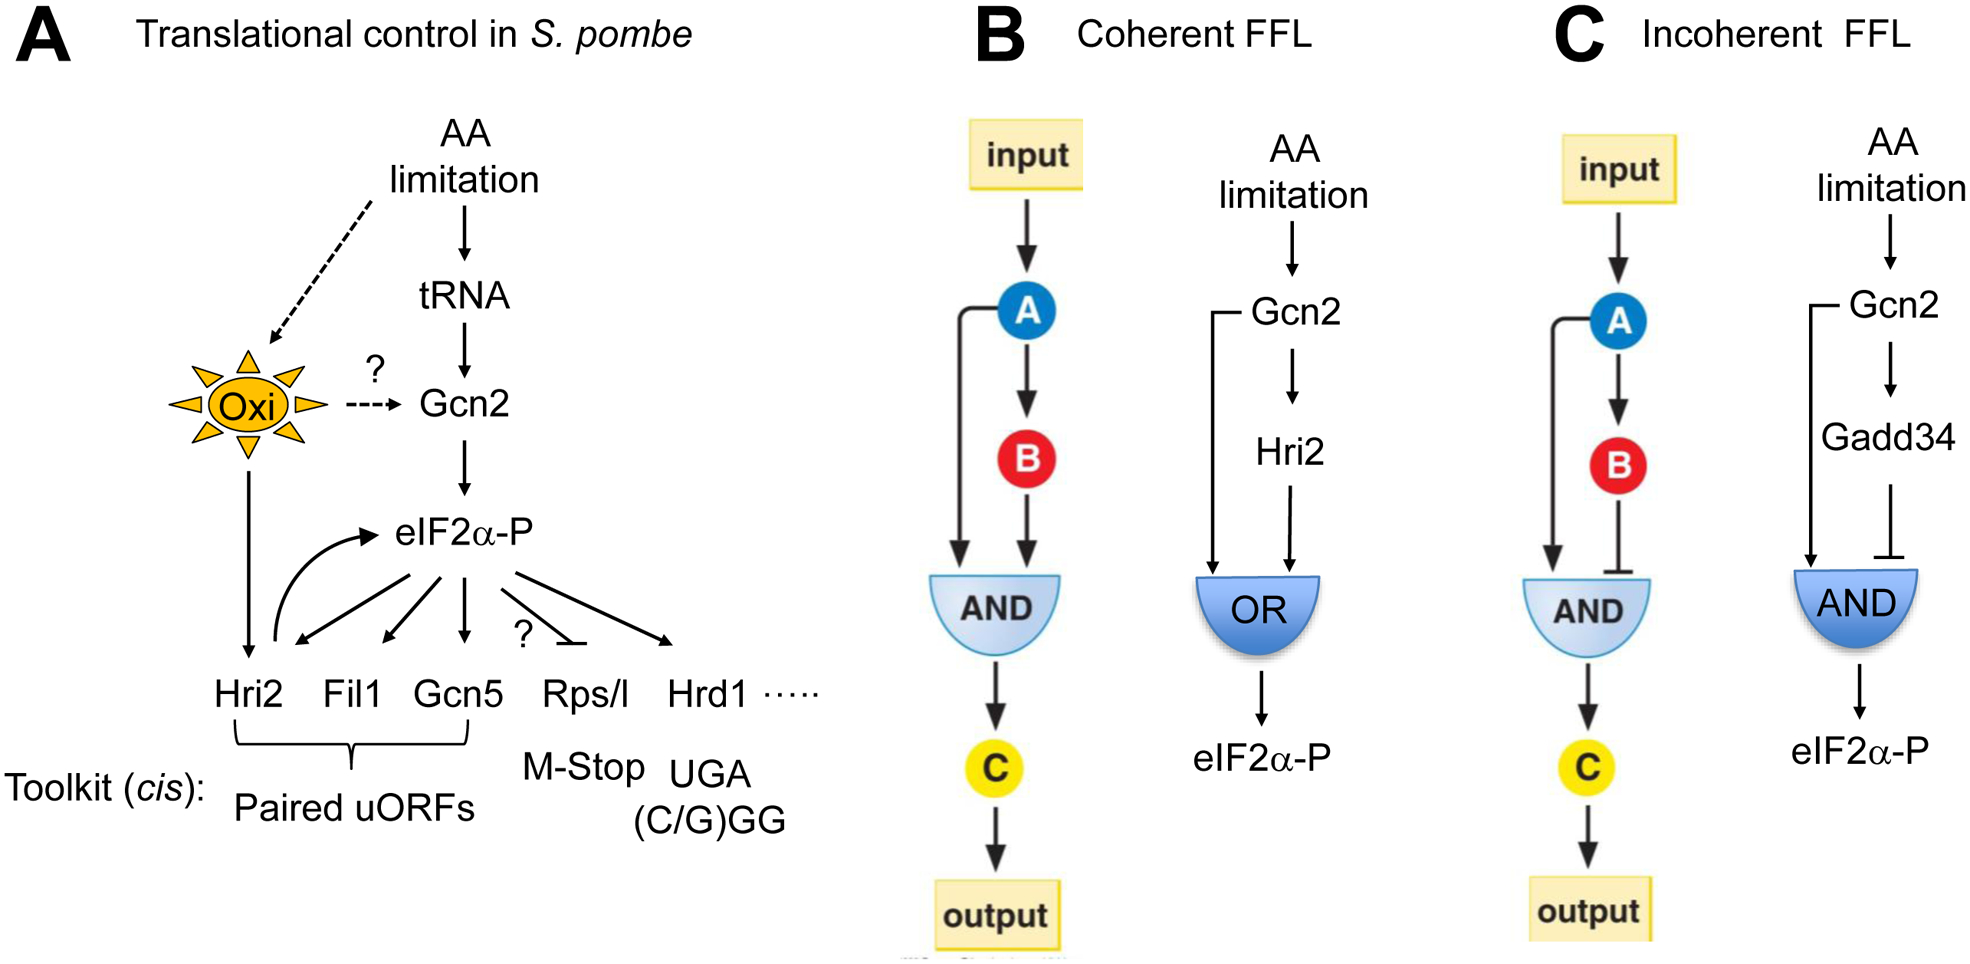
During amino acid limitation, the protein kinase Gcn2 phosphorylates the α subunit of eIF2, thereby regulating mRNA translation. In yeast Saccharomyces cerevisiae and mammals, eIF2α phosphorylation regulates translation of related transcription factors Gcn4 and Atf4 through upstream open reading frames (uORFs) to activate transcription genome wide. However, mammals encode three more eIF2α kinases activated by distinct stimuli. Did the translational control system involving eIF2α phosphorylation evolve from so simple (as found in yeast S. cerevisiae) to complex (as found in humans)? Recent genome-wide translational profiling studies of amino acid starvation response in the fission yeast Schizosaccharomyces pombe provide an unexpected answer to this question.
Keywords: Evolution; Schizosaccharomyces pombe; Translational control; eIF2α kinase; uORF.
Figures
Similar articles
-
A single inhibitory upstream open reading frame (uORF) is sufficient to regulate Candida albicans GCN4 translation in response to amino acid starvation conditions.RNA. 2014 Apr;20(4):559-67. doi: 10.1261/rna.042267.113. Epub 2014 Feb 25. RNA. 2014. PMID: 24570481 Free PMC article.
-
An upstream ORF with non-AUG start codon is translated in vivo but dispensable for translational control of GCN4 mRNA.Nucleic Acids Res. 2011 Apr;39(8):3128-40. doi: 10.1093/nar/gkq1251. Epub 2011 Jan 11. Nucleic Acids Res. 2011. PMID: 21227927 Free PMC article.
-
Gene-specific translational control of the yeast GCN4 gene by phosphorylation of eukaryotic initiation factor 2.Mol Microbiol. 1993 Oct;10(2):215-23. doi: 10.1111/j.1365-2958.1993.tb01947.x. Mol Microbiol. 1993. PMID: 7934812 Review.
-
The eukaryotic initiation factor (eIF) 4G HEAT domain promotes translation re-initiation in yeast both dependent on and independent of eIF4A mRNA helicase.J Biol Chem. 2010 Jul 16;285(29):21922-33. doi: 10.1074/jbc.M110.132027. Epub 2010 May 12. J Biol Chem. 2010. PMID: 20463023 Free PMC article.
-
New functions of protein kinase Gcn2 in yeast and mammals.IUBMB Life. 2012 Dec;64(12):971-4. doi: 10.1002/iub.1090. Epub 2012 Nov 5. IUBMB Life. 2012. PMID: 23129244 Review.
Cited by
-
The heme-regulated inhibitor kinase Hri1 is activated in response to aminolevulinic acid deficiency in Schizosaccharomyces pombe.PLoS Genet. 2025 Jul 16;21(7):e1011797. doi: 10.1371/journal.pgen.1011797. eCollection 2025 Jul. PLoS Genet. 2025. PMID: 40668850 Free PMC article.
-
Cerebral Glucose Metabolism and Potential Effects on Endoplasmic Reticulum Stress in Stroke.Aging Dis. 2023 Apr 1;14(2):450-467. doi: 10.14336/AD.2022.0905. eCollection 2023 Apr 1. Aging Dis. 2023. PMID: 37008060 Free PMC article. Review.
-
Translation-complex profiling of fission yeast cells reveals dynamic rearrangements of scanning ribosomal subunits upon nutritional stress.Nucleic Acids Res. 2022 Dec 9;50(22):13011-13025. doi: 10.1093/nar/gkac1140. Nucleic Acids Res. 2022. PMID: 36478272 Free PMC article.
-
Exosomal miR-129 and miR-342 derived from intermittent hypoxia-stimulated vascular smooth muscle cells inhibit the eIF2α/ATF4 axis from preventing calcified aortic valvular disease.J Cell Commun Signal. 2023 Dec;17(4):1449-1467. doi: 10.1007/s12079-023-00785-4. Epub 2023 Oct 9. J Cell Commun Signal. 2023. PMID: 37812275 Free PMC article.
-
The role of upstream open reading frames in translation regulation in the apicomplexan parasites Plasmodium falciparum and Toxoplasma gondii.Parasitology. 2021 Sep;148(11):1277-1287. doi: 10.1017/S0031182021000937. Epub 2021 Jun 8. Parasitology. 2021. PMID: 34099078 Free PMC article. Review.
References
-
- Alon U (2007). Network motifs: theory and experimental approaches. Nat Rev Genet 8, 450–461. - PubMed
-
- Asano K (2013). Translational Control. In Encyclopedia of Systems Biology, Dubitzky W, Wolkenhauser O, Cho K-H, and Yokota H, eds. (New York: Springer; ), pp. 2278–2282.
-
- Asano K, and Mizobuchi K (1998). An RNA Pseudoknot as the molecular switch for translation of the repZ gene encoding the replication initiator of IncIa plasmid ColIb-P9. J Biol Chem 273, 11815–11825. - PubMed
Publication types
MeSH terms
Substances
Grants and funding
LinkOut - more resources
Full Text Sources
Other Literature Sources
