Genome-Wide Association Study (GWAS) to Identify Salt-Tolerance QTLs Carrying Novel Candidate Genes in Rice During Early Vegetative Stage
- PMID: 33420909
- PMCID: PMC7797017
- DOI: 10.1186/s12284-020-00433-0
Genome-Wide Association Study (GWAS) to Identify Salt-Tolerance QTLs Carrying Novel Candidate Genes in Rice During Early Vegetative Stage
Abstract
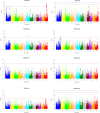
Background: Rice is considered as a salt-sensitive plant, particularly at early vegetative stage, and its production is suffered from salinity due to expansion of salt affected land in areas under cultivation. Hence, significant increase of rice productivity on salinized lands is really necessary. Today genome-wide association study (GWAS) is a method of choice for fine mapping of QTLs involved in plant responses to abiotic stresses including salinity stress at early vegetative stage. In this study using > 33,000 SNP markers we identified rice genomic regions associated to early stage salinity tolerance. Eight salinity-related traits including shoot length (SL), root length (RL), root dry weight (RDW), root fresh weight (RFW), shoot fresh weight (SFW), shoot dry weight (SDW), relative water content (RWC) and TW, and 4 derived traits including SL-R, RL-R, RDW-R and RFW-R in a diverse panel of rice were evaluated under salinity (100 mM NaCl) and normal conditions in growth chamber. Genome-wide association study (GWAS) was applied based on MLM(+Q + K) model.
Results: Under stress conditions 151 trait-marker associations were identified that were scattered on 10 chromosomes of rice that arranged in 29 genomic regions. A genomic region on chromosome 1 (11.26 Mbp) was identified which co-located with a known QTL region SalTol1 for salinity tolerance at vegetative stage. A candidate gene (Os01g0304100) was identified in this region which encodes a cation chloride cotransporter. Furthermore, on this chromosome two other candidate genes, Os01g0624700 (24.95 Mbp) and Os01g0812000 (34.51 Mbp), were identified that encode a WRKY transcription factor (WRKY 12) and a transcriptional activator of gibberellin-dependent alpha-amylase expression (GAMyb), respectively. Also, a narrow interval on the same chromosome (40.79-42.98 Mbp) carries 12 candidate genes, some of them were not so far reported for salinity tolerance at seedling stage. Two of more interesting genes are Os01g0966000 and Os01g0963000, encoding a plasma membrane (PM) H+-ATPase and a peroxidase BP1 protein. A candidate gene was identified on chromosome 2 (Os02g0730300 at 30.4 Mbp) encoding a high affinity K+ transporter (HAK). On chromosome 6 a DnaJ-encoding gene and pseudouridine synthase gene were identified. Two novel genes on chromosome 8 including the ABI/VP1 transcription factor and retinoblastoma-related protein (RBR), and 3 novel genes on chromosome 11 including a Lox, F-box and Na+/H+ antiporter, were also identified.
Conclusion: Known or novel candidate genes in this research were identified that can be used for improvement of salinity tolerance in molecular breeding programmes of rice. Further study and identification of effective genes on salinity tolerance by the use of candidate gene-association analysis can help to precisely uncover the mechanisms of salinity tolerance at molecular level. A time dependent relationship between salt tolerance and expression level of candidate genes could be recognized.
Keywords: Genome-wide association mapping; Molecular breeding; Rice; SNPs; Salinity.
Conflict of interest statement
The authors declare that they have no competing interests.
Figures


Similar articles
-
Molecular Dissection of Seedling Salinity Tolerance in Rice (Oryza sativa L.) Using a High-Density GBS-Based SNP Linkage Map.Rice (N Y). 2016 Dec;9(1):52. doi: 10.1186/s12284-016-0125-2. Epub 2016 Oct 1. Rice (N Y). 2016. PMID: 27696287 Free PMC article.
-
Genome-Wide Association Mapping of Salinity Tolerance at the Seedling Stage in a Panel of Vietnamese Landraces Reveals New Valuable QTLs for Salinity Stress Tolerance Breeding in Rice.Plants (Basel). 2021 May 28;10(6):1088. doi: 10.3390/plants10061088. Plants (Basel). 2021. PMID: 34071570 Free PMC article.
-
Genome-wide association mapping of salinity tolerance in rice (Oryza sativa).DNA Res. 2015 Apr;22(2):133-45. doi: 10.1093/dnares/dsu046. Epub 2015 Jan 27. DNA Res. 2015. PMID: 25627243 Free PMC article.
-
Salt tolerance in rice: seedling and reproductive stage QTL mapping come of age.Theor Appl Genet. 2021 Nov;134(11):3495-3533. doi: 10.1007/s00122-021-03890-3. Epub 2021 Jul 21. Theor Appl Genet. 2021. PMID: 34287681 Free PMC article. Review.
-
Advances in understanding salt tolerance in rice.Theor Appl Genet. 2019 Apr;132(4):851-870. doi: 10.1007/s00122-019-03301-8. Epub 2019 Feb 13. Theor Appl Genet. 2019. PMID: 30759266 Review.
Cited by
-
Candidate gene discovery for salt tolerance in rice (Oryza sativa L.) at the germination stage based on genome-wide association study.Front Plant Sci. 2022 Nov 1;13:1010654. doi: 10.3389/fpls.2022.1010654. eCollection 2022. Front Plant Sci. 2022. PMID: 36388603 Free PMC article.
-
OsCIPK9 Interacts with OsSOS3 and Affects Salt-Related Transport to Improve Salt Tolerance.Plants (Basel). 2023 Oct 30;12(21):3723. doi: 10.3390/plants12213723. Plants (Basel). 2023. PMID: 37960079 Free PMC article.
-
Genome-wide identification, characterization, and expression analysis unveil the roles of pseudouridine synthase (PUS) family proteins in rice development and stress response.Physiol Mol Biol Plants. 2023 Dec;29(12):1981-2004. doi: 10.1007/s12298-023-01396-4. Epub 2023 Nov 30. Physiol Mol Biol Plants. 2023. PMID: 38222285 Free PMC article.
-
Progress and prospects in harnessing wild relatives for genetic enhancement of salt tolerance in rice.Front Plant Sci. 2024 Jan 31;14:1253726. doi: 10.3389/fpls.2023.1253726. eCollection 2023. Front Plant Sci. 2024. PMID: 38371332 Free PMC article. Review.
-
Molecular Mapping to Discover Reliable Salinity-Resilient QTLs from the Novel Landrace Akundi in Two Bi-Parental Populations Using SNP-Based Genome-Wide Analysis in Rice.Int J Mol Sci. 2023 Jul 6;24(13):11141. doi: 10.3390/ijms241311141. Int J Mol Sci. 2023. PMID: 37446320 Free PMC article.
References
-
- Amin US, Biswas S, Elias SM, Razzaque S, Haque T, Malo R, Seraj ZI. Enhanced salt tolerance conferred by the complete 2.3 kb cDNA of the rice vacuolar Na+/H+ antiporter gene compared to 1.9 kb coding region with 5′-UTR in transgenic lines of rice. Front Plant Sci. 2016;7:14. doi: 10.3389/fpls.2016.00014. - DOI - PMC - PubMed
-
- Ammar MHM, Singh RK, Singh AK, Mohapatra T, Sharma TR, Singh NK. African Crop Science Conference Proceedings. 2007. Mapping QTLs for salinity tolerance at seedling stage in rice (Oryza sativa L.) pp. 617–620.
LinkOut - more resources
Full Text Sources
Other Literature Sources
Miscellaneous

