. 2021 Jan 20;80(2):112-128.
doi: 10.1093/jnen/nlaa157.

Expression of GFAP and Tau Following Blast Exposure in the Cerebral Cortex of Ferrets

Affiliations

Expression of GFAP and Tau Following Blast Exposure in the Cerebral Cortex of Ferrets

Susan C Schwerin et al. J Neuropathol Exp Neurol. .

Abstract

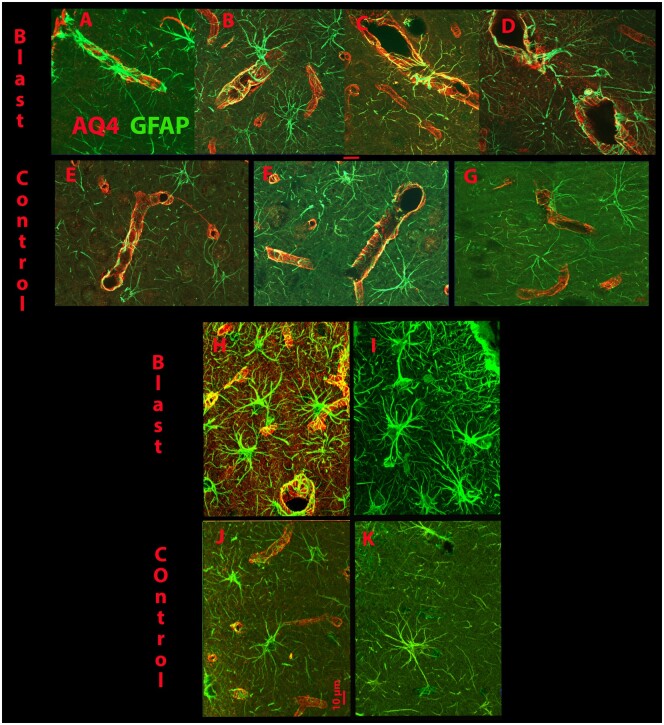
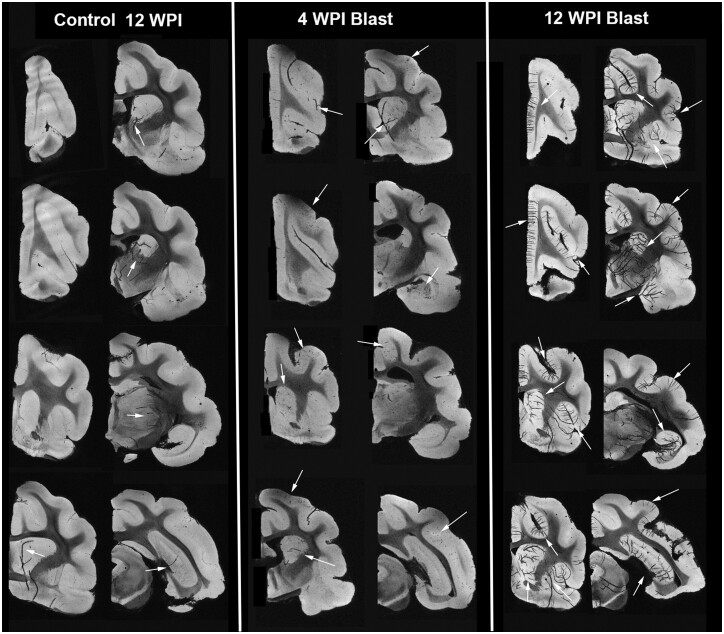
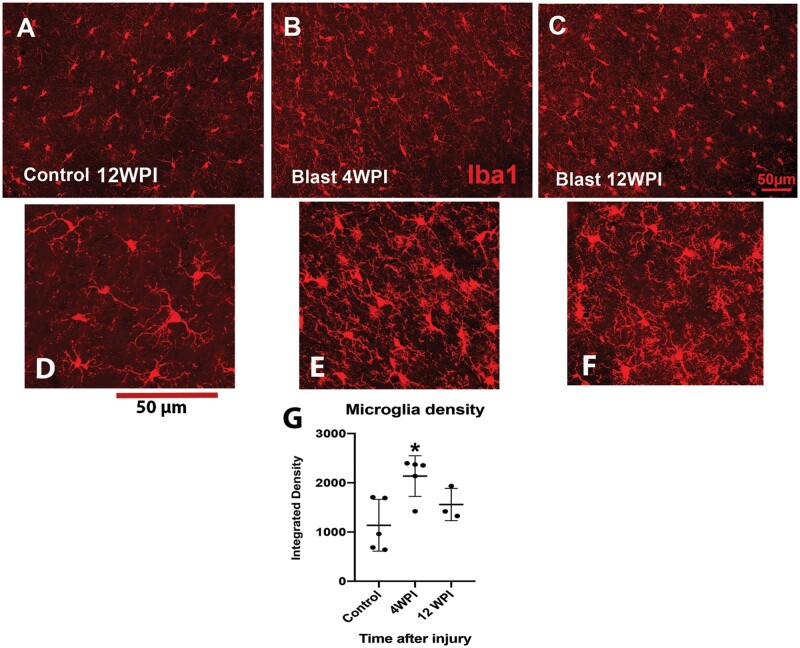
Blast exposures are a hallmark of contemporary military conflicts. We need improved preclinical models of blast traumatic brain injury for translation of pharmaceutical and therapeutic protocols. Compared with rodents, the ferret brain is larger, has substantial sulci, gyri, a higher white to gray matter ratio, and the hippocampus in a ventral position; these attributes facilitate comparison with the human brain. In this study, ferrets received compressed air shock waves and subsequent evaluation of glia and forms of tau following survival of up to 12 weeks. Immunohistochemistry and Western blot demonstrated altered distributions of astrogliosis and tau expression after blast exposure. Many aspects of the astrogliosis corresponded to human pathology: increased subpial reactivity, gliosis at gray-white matter interfaces, and extensive outlining of blood vessels. MRI analysis showed numerous hypointensities occurring in the 12-week survival animals, appearing to correspond to luminal expansions of blood vessels. Changes in forms of tau, including phosphorylated tau, and the isoforms 3R and 4R were noted using immunohistochemistry and Western blot in specific regions of the cerebral cortex. Of particular interest were the 3R and 4R isoforms, which modified their ratio after blast. Our data strongly support the ferret as an animal model with highly translational features to study blast injury.

Keywords: Aquaporin; Astrocyte; Blood vessels; Phosphorylated tau; Pia; Tau isoforms.


Figures

FIGURE 1.
FIGURE 1.
Examples of coronal sections in the parietal cortex taken from animals receiving single or multiple blasts. Compared with a control animal (A), those receiving a single blast and surviving for 1 or 4 weeks show evident astrocytic reactivity (B, C), which is especially evident surrounding blood vessels (red arrows), but reduced from the animal with multiple blasts surviving 4 weeks post injury (D). By 4 weeks of survival with 4 blast injuries in one day, the GFAP immunoreactivity has increased dramatically in the white matter, subpial region and surrounding blood vessels. Also shown are higher-power images showing examples of GFAP immunoreactivity surrounding blood vessels in control (E) and animals receiving a single blast and surviving for 1 week post injury (F) or 4 weeks post injury (G) or an example of an animal receiving 4 blasts and surviving for 4 weeks post injury (H). WPI, weeks post injury. Scale = 200 µm for upper and lower scale bars.
FIGURE 2.
FIGURE 2.
GFAP immunoreactivity in control and blast-injured animals. (A) Example of a coronal section through the level of the caudate/putamen and internal capsule showing the normal (control) immunoreactivity for GFAP (astrocytes). Slight staining can be seen in the white matter, in the septal region and ventrally surrounding blood vessels. (B) A coronal section in a similar region in an animal that received 4 blast injuries in one day and survived for 4 weeks (WPI). Substantially more immunoreactivity can be seen in the white matter and surrounding blood vessels. (C) Displays a higher-power view with strong reactivity in the white matter where several sites show clusters of immunoreactive cells. Increased reactivity can also be seen in the subpial region and at gray-white matter interfaces. (D, E) Panels show the subpial region at higher power where strongly reactive astrocytes are evident in the section obtained from the animal with blast injury (E), whereas the same region in a control animal (D) shows lightly stained astrocytes with few intense processes. (F, G) Images taken from the fundus of the coronal sulcus and indicate that for the blast-injured animal (G), the immunoreactivity is substantially more extensive than for the control animal (F). Scale bars: C = 100 µm, D and E = 50 µm, F and G = 200 µm.
FIGURE 3.
FIGURE 3.
Quantification of the immunoreactive density in a region occupied by GFAP immunoreactive astrocytes in the subpial and white matter region of the frontoparietal cortex after 4 shock wave (blast) exposures. (A) Indicates the region that measurements were taken; the black oval surrounded by the red oval, indicates the site of the pial samples and the black square surrounded by the red square indicates the site of the white matter samples. To assess overall area of GFAP fluorescence, 3–4 sections were measured and averaged for each brain; 3–4 brains were used in each condition. (B, C) Images of GFAP immunoreactivity in the white matter taken from a control (B) and a 12 weeks post injury animal (C). The control animals used here survived for 12 weeks post injury. For the white matter measurements, the animals surviving for 12 weeks showed a significant increase compared with the control (F, one way ANOVA followed by a Tukey multiple comparison test, *p = 0.03). The animals surviving for 4 weeks also showed increases but they were not significant. (D, E) Examples of GFAP immunoreactivity in the subpial region for a control (D) and 12-week survival animal (E). The animals surviving for 12 weeks showed significantly greater area occupied by GFAP reactivity compared with the control (G, unpaired t test, *p = 0.02).
FIGURE 4.
FIGURE 4.
Examples of immunoreactivity for GFAP and Aquaporin 4 (AQ4) in the prefrontal cortex. (A–D) The top row shows examples of merged immunoreactivity of GFAP and AQ4 surrounding blood vessels in the prefrontal cortex in animals that received 4 blast injuries and survived for 12 weeks. The control animals were also in the 12-week survival group. (E–G) Panels show similar examples taken from control animals. The examples taken from the injured animals (A–D) show increased GFAP reactivity surrounding the blood vessels and integrating with the AQ4 reactivity compared with the images taken from the control animals (E–G). (H, I) Views of subpial astrocytes that are more engorged with thicker processes in injured animals (Blast) compared with the control animals (J, K). Also seen is greater integration of the astrocytes (GFAP) with AQ4 reactivity in H compared with J. The red scale bar = 10 µm.
FIGURE 5.
FIGURE 5.
High-resolution MR volumes of 1-mm-thickness obtained from control and injured brains that survived for 12 or 4 WPI (weeks post injury); representative rostral to caudal images are shown. Although a few hypointensities can be seen in the control sections (arrows) 12-week survival period, they are not prevalent. In the injured brains shown in the middle 2 columns from 4 WPI brains, limited hypointensities are visible (arrows) that appear to correspond to blood vessels. For the injured brains surviving for 12 WPI (right 2 columns) multiple hypointensities are strongly evident (arrows).
FIGURE 6.
FIGURE 6.
Comparison of MRI with immunohistology and quantification. (A) Example of Aquaporin 4 reactivity in the brain of an animal receiving 4 shock wave injuries and surviving for 12 weeks. (B) Minimum intensity projection (MIP) MRI taken from the same brain indicating regions of hypointensities that appear to correspond to blood vessels. (C) A higher-power view of the boxed in region in (A). The asterisks indicate corresponding sites in the MRI and the histology. Panels A and B do not show identical features as the MIP MRI shown in B is much thicker (∼1 mm) than the histology image (50 µm). Panel C shows quantification of the area occupied by the presumptive blood vessels in the control (n = 6) 12-week survival period, 4 week post injury survival (n = 4), and 12 week post injury survival (n = 2) MRIs. The area occupied by the presumptive blood vessels was significantly increased in the animals surviving 12 weeks post injury compared with the control (***p = 0.0009) and 4-week survival (***p < 0.0008) animals. One-way ANOVA followed by a Tukey post hoc comparison.
FIGURE 7.
FIGURE 7.
Examples of immunoreactivity for microglia using Iba1. We obtained density measurements in the posterior sigmoid gyrus and found that fluorescent density was increased significantly in animals that survived 4 weeks post injury (WPI) (B) and although the density remained slightly increased at 12 WPI (C), it was not significantly different from the control density obtained at 12 WPI (A). At least 3 sections per animal were obtained and averaged, and 3–5 animals used per group. WPI, weeks post injury (D). We used a 1-way ANOVA followed by a Tukey post hoc analysis. *p < 0.05.
FIGURE 8.
FIGURE 8.
Quantification of Western blots for (A) HT7 (total tau), (B) CP13 (phosphorylated tau), and the tau isoforms (E) 3R and (F) 4R. Several regions of the cerebral cortex were analyzed for measurement of HT7, CP13, 3R, and 4R using Western blot with GAPDH as a loading control. (A) For HT7 (4 blasts surviving for 12 weeks) the PFC (prefrontal cortex) showed a significant decrease. (B) When assessing the protein expression of CP13 (pTau) all regions showed a significant increase, except the PFC, which only showed a slight increase. The arrows point to the molecular weight for HT7 or CP13. Four brains were used for each analysis, a 2-way ANOVA was followed by a Sidak post hoc test. **p < 0.01, ***p < 0.001. (C, D) Examples of the relative levels of the 3R and 4R isoforms of tau. In control brains obtained at 12 weeks post injury (C), there are no significant differences between the expression levels of each. (D) After injury (4 blasts, survival for 12 weeks) significant differences emerge for the relative level of expression for 3R and 4R isoforms. This occurs for the TCL and PFC, which now show significant differences between control and injured levels. A 2-way ANOVA was followed by Sidak post hoc test. ****p < 0.0001. The same regions of the cerebral cortex were analyzed for measurement of 3R or 4R. (E) For 3R, significant increases were observed for the TCL (temporal cortex lateral) and the prefrontal cortex (PFC). A slight, but not significant decrease was observed for the OCL (occipital cortex lateral) after a blast injury (4 blasts surviving for 12 weeks). (F) For 4R, we observed a significant increase for the FCM (frontal cortex medial) and a decrease for the PFC (prefrontal cortex). The arrows point to the molecular weight for 3R or 4R. OCL, occipital cortex lateral, TCL, temporal cortex lateral, FCM, frontal cortex medial. Four brains were used for each analysis, a 2-way ANOVA was followed by a Sidak post hoc test. *p < 0.05; **p < 0.01.
FIGURE 9.
FIGURE 9.
Examples of immunoreactivity for pTau in the hippocampus of control and injured brains. Shown here are representative sections from control and animals injured with 4 blasts and surviving for 12 weeks, using either AT8 (A, B) or CP13 (C, D) as the antibody. The injured brain shows increased reactivity with both antibodies, but in slightly different regions depending on the antibody. AT8 (A, B) reveals increased reactivity in the axons projecting between the dentate gyrus and hippocampus proper (arrows) and CP13 (C, D) reveals increased numbers of labeled cells in the upper layers of the hippocampus (arrows). (E, F) Examples of immunoreactivity against AT8. This shows immunoreactivity in the temporal cortex for control obtained at 4 weeks post injury (E) and blast (F) injured brains. Although the number of cells and density of labeled axons appears greater in the inured brain (F), a substantial amount of immunoreactivity is present in the control brain as well.
FIGURE 10.
FIGURE 10.
3R immunoreactivity in the hippocampus and prefrontal cortex. (A, B) In the hippocampus, label for 3R is present in both the control and injured brains, but reactivity for axons running between the dentate gyrus and hippocampus proper is clearly increased in the injured brain (arrows). A greater number of cells and processes are also obvious in the injured hippocampus proper (asterisks). (C, D) In the prefrontal cortex, more labeled cells are present in layer two of the injured brain (D), compared with the control (C). The red horizonal lines in the bottom 2 images represent the boundary between layer 1 and 2. The red scale bar equals 500 µm in the top 2 panels (A, B, hippocampus) and 100 µm in the bottom 2 panels (C, D, prefrontal cortex).
FIGURE 11.
FIGURE 11.
3R label in the temporal cortex. These are examples of 3R immunoreactivity in layer 2 of the temporal cortex of control (A) and blast-injured (B) brains. The boxed in area is shown at higher power in the upper right of each image. Increased numbers of cells can be seen in the injured brain. WPI, weeks post injury.
FIGURE 12.
FIGURE 12.
3R Immunoreactivity surrounding the anterior pole of the lateral ventricle. Examples of 3R labeling in 2 control (A, C, on the left) and 2 injured brains (B, D, on the right) showing increased reactivity in the injured brains accompanying enlarged openings in the anterior process of the lateral ventricle.

References

    1. LaValle CR, Carr WS, Egnoto MJ, et al. Neurocognitive performance deficits related to immediate and acute blast overpressure exposure. Front Neurol 2019;10:949. - PMC - PubMed
    1. Wang Z, Wilson CM, Mendelev N, et al. Acute and chronic molecular signatures and associated symptoms of blast exposure in military breachers. J Neurotrauma 2020;37:1221–32 - PMC - PubMed
    1. Bryden DW, Tilghman JI, Hinds SR 2nd. Blast-related traumatic brain injury: Current concepts and research considerations. J Exp Neurosci 2019;13:117906951987221 - PMC - PubMed
    1. Goldstein LE, McKee AC, Stanton PK. Considerations for animal models of blast-related traumatic brain injury and chronic traumatic encephalopathy. Alzheimers Res Ther 2014;6:64. - PMC - PubMed
    1. Gama Sosa MA, De Gasperi R, Janssen PL, et al. Selective vulnerability of the cerebral vasculature to blast injury in a rat model of mild traumatic brain injury. Acta Neuropathol Commun 2014;2:67. - PMC - PubMed

Publication types

Substances