. 2021 Feb;35(2):e21317.
doi: 10.1096/fj.202001018R.

Lipocalin-2 mediates the rejection of neural transplants

Affiliations

Lipocalin-2 mediates the rejection of neural transplants

Yi-Chinn Weng et al. FASEB J. 2021 Feb.

Abstract

Lipocalin-2 (LCN2) has been implicated in promoting apoptosis and neuroinflammation in neurological disorders; however, its role in neural transplantation remains unknown. In this study, we cultured and differentiated Lund human mesencephalic (LUHMES) cells into human dopaminergic-like neurons and found that LCN2 mRNA was progressively induced in mouse brain after the intrastriatal transplantation of human dopaminergic-like neurons. The induction of LCN2 protein was detected in a subset of astrocytes and neutrophils infiltrating the core of the engrafted sites, but not in neurons and microglia. LCN2-immunoreactive astrocytes within the engrafted sites expressed lower levels of A1 and A2 astrocytic markers. Recruitment of microglia, neutrophils, and monocytes after transplantation was attenuated in LCN2 deficiency mice. The expression of M2 microglial markers was significantly elevated and survival of engrafted neurons was markedly improved after transplantation in LCN2 deficiency mice. Brain type organic cation transporter (BOCT), the cell surface receptor for LCN2, was induced in dopaminergic-like neurons after differentiation, and treatment with recombinant LCN2 protein directly induced apoptosis in dopaminergic-like neurons in a dose-dependent manner. Our results, therefore, suggested that LCN2 is a neurotoxic factor for the engrafted neurons and a modulator of neuroinflammation. LCN2 inhibition may be useful in reducing rejection after neural transplantation.

Keywords: Lipocalin-2; graft; neuroinflammation; neutrophil gelatinase-associated lipocalin; rejection; transplantation.


Conflict of interest statement

The authors have declared that no competing interests exist.

Figures

FIGURE 1
FIGURE 1
Experimental procedure. LUHMES cells were seeded and allowed to proliferate for 3 to 4 days before differentiation. Bright‐field and immunofluorescence (IF) images of 2D and 3D LUHMES cells were collected before and after differentiation. After 4 to 5 days of differentiation, 3D LUHMES neurospheres were transplanted into mouse brains. Mouse brains isolated before and after transplantation were analyzed by quantitative PCR (qPCR) and immunohistochemistry (IHC)
FIGURE 2
FIGURE 2
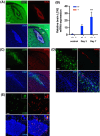
Induction of LCN2 after the transplantation of LUHMES neurospheres. A, Expression of MAP2 (green) and a human nuclei specific marker (HuNu, red) in the striatum was detected by immunofluorescence staining and confocal microscopy on day 1 after transplantation. Nuclei were labeled with DAPI (blue). HuNu‐immunoreactive LUHMES neurons were identified as a mass of cells in the striatum. * indicates the area of cell death induced by hypoxia and anoikis; cc, corpus callosum; ctx, cortex; str, striatum. B, Total RNA isolated from the ipsilateral hemispheres of naïve LCN2+/+ and LCN2 −/− mice (control), and 3 and 7 days after transplantation were analyzed by real‐time RT‐PCR (n = 4 per group). Relative expression LCN2 mRNA in the brain homogenates was compared between groups using one‐way ANOVA and Newman‐Keuls post hoc tests. LCN2 mRNA level was significantly induced 7 days after transplantation (***P < .001) as compared to naïve LCN2+/+ mice. C and D, Immunoreactivity of LCN2 (green) and MAP2 (red) in the striatum on day 7 after transplantation. D, Higher magnification of confocal images demonstrating LCN2‐immunoreactive cells (green) induced around the MAP2‐immunoreactive LUHMES neurons (red). E. Immunoreactivity of LCN2 (green) and 7/4 (red) in the engrafted site in the striatum on day 1 after transplantation. Enlarged views of boxed areas showing that LCN2 immunoreactivity (green) in the cytoplasm of an infiltrating neutrophil with a polymorphonuclear nucleus (red). Scale bars, 250 μm in A and C, and 50 μm in D and E
FIGURE 3
FIGURE 3
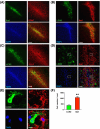
Spatial relationship between LCN2 expression, astrocytes, and microglia surrounding the graft. A, Recruitment of Iba1‐immunoreactive microglia (green) and GFAP‐immunoreactive astrocytes (red) in the striatum 7 days after transplantation. Induction of LCN2 (green) and Iba1 (red) (B, D) or GFAP (red) (C) in the striatum 7 days after transplantation. E, Enlarged views of the boxed area in D showing that LCN2 (green) is not expressed in the Iba1‐immunoreactive microglia (red). Nuclei were labeled with DAPI (blue). Scale bars, 250 μm in A‐C, 50 μm in D, and 5 μm in E. F, The numbers of LCN2‐ or Iba1‐immunoreactive cells on day 7 after transplantation (n = 3). **P < .001 compared between groups using the two‐tailed, unpaired t‐test
FIGURE 4
FIGURE 4
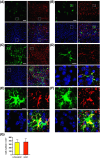
Detection of LCN2 in a subset of astrocytes after transplantation. Immunoreactivity of LCN2 (green) and astrocyte‐specific marker GFAP (red) in the striatum on day 1 (A), day 3 (B), and day 7 (C) after transplantation. D‐F, Enlarged views of boxed areas in A‐C showing the expression of LCN2 (green) in the GFAP‐immunoreactive astrocytes (red). Nuclei were labeled with DAPI (blue). Scale bars, 50 μm for the main images in A‐C, and 5 μm for the amplified images in D‐F. G, The numbers of astrocytes immunoreactive for both LCN2 and GFAP, or for GFAP only, on day 7 after transplantation (n = 3). P = .9058 compared between groups using the two‐tailed, unpaired t‐test
FIGURE 5
FIGURE 5
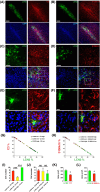
Immunoreactivity of LCN2 (green) and C3 (red) (A, C, E), or LCN2 (green) and S100A10 (red) (B, D, F) in the striatum on day 7 after transplantation. C and D, Higher magnification of confocal images demonstrating that LCN2‐immunoreactive astrocytes (green) were located closer to the engrafted site on the left. E and F, Enlarged views of boxed areas in C and D. Nuclei were labeled with DAPI (blue). Scale bars, 250 μm in A and B, 50 μm in C and D, and 5 μm in E and F. Percentages of LCN2 and C3 immunoreactivity (G), or LCN2 and S100A10 immunoreactivity (H) in astrocytes in the engrafted sites on day 7 after transplantation (n = 60). I, J, The numbers of astrocytes expressing a low level of LCN2 and a high level of C3 or S100A10 (red), medium levels of LCN2 and C3 or LCN2 and S100A10 (yellow), and a high level of LCN2 and a low level of C3 or S100A10 (green) (n = 3 per group). Cell numbers were compared between groups using one‐way ANOVA and Newman–Keuls post hoc tests (***P < .001). The areas (µm2) occupied by LCN2‐ and C3‐immunoreactive (K) or LCN2‐ and S100A10‐immunoreactive (L) astrocytes (n = 30 per group). *P < .05 compared with the area occupied by LCN2‐immunoreactive astrocytes (two‐tailed, unpaired t‐test)
FIGURE 6
FIGURE 6
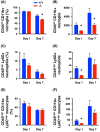
Recruitment of microglia, neutrophils, and monocytes after transplantation was attenuated in LCN2 deficiency mice. Flow cytometric analysis of the percentages (A, C, E) and numbers (B, D, F) of CD45int CD11b+ microglia (A, B), CD45high Ly6G+ neutrophils (C, D), and CD45high CD11b+ Ly6Chigh monocytes (E, F) in the ipsilateral hemisphere on day 1 and day 7 after transplantation (n = 5 per group). The percentages and numbers of microglia and immune cells were compared between LCN2+/+ and LCN2 −/− mice, on day 1 or day 7 after transplantation, using the two‐tailed, unpaired t‐test (*P < .05)
FIGURE 7
FIGURE 7
The expression of M2 microglial markers were elevated on day 7 after transplantation in LCN2 deficiency mice. Total RNA isolated from the ipsilateral hemispheres of naive LCN2+/+ and LCN2 −/− mice (control), and at 3 and 7 days after transplantation, were analyzed by real‐time RT‐PCR (n = 4 per group). Relative mRNA expression of the target genes in the brain homogenates was compared between groups using one‐way ANOVA and Newman–Keuls post hoc tests (***P < .001, **P < .01, *P < .05; NS, not significant)
FIGURE 8
FIGURE 8
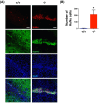
The number of surviving LUHMES cells after transplantation was increased in LCN2 deficiency mice. A, Confocal images of HuNu (red) and MAP2 (green) immunoreactivity in the striatum of LCN2+/+ and LCN2 −/− mice 7 days after transplantation. Scale bar, 50 μm. B, Significantly more HuNu‐immunoreactive cells were observed in LCN2 −/− vs LCN2+/+ mice (n = 5). *P < .05 compared with LCN2+/+ mice (two‐tailed, unpaired t‐test)
FIGURE 9
FIGURE 9
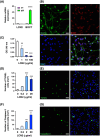
LCN2 induced cell death in 2D LUHMES neurons. A, Total RNA was isolated from undifferentiated (un) 2D LUHMES cells and from cells 6 days after differentiation (diff). RNA was analyzed by real‐time RT‐PCR (n = 5). Relative expression of LCN2 and BOCT mRNA was compared between undifferentiated and differentiated cells using the two‐tailed, unpaired t‐test. BOCT mRNA expression was significantly increased at 6 days after differentiation compared to undifferentiated cells (****P < .0001). B, Confocal images showing the expression pattern of BOCT in 2D LUHMES neurons. Neurons were stained for the neuronal marker MAP2 (green) and BOCT (red). C‐G, 2D LUHMES neurons were incubated with increasing concentrations of recombinant human LCN2 protein at 37°C for 24 hours. C, The viability of neurons after LCN2 treatment was determined by MTT assays (n = 5). D, The number of apoptotic neurons labeled by TUNEL assay after LCN2 treatment (n = 6). E, Confocal images showing the TUNEL‐positive neurons (green) after treatment with recombinant human LCN2 protein (2 μg/mL). F, The numbers of apoptotic neurons expressing cleaved caspase‐3 after LCN2 treatment (n = 6). **P < .01, ***P < .001 compared with vehicle control (one‐way ANOVA and Newman–Keuls post hoc test). G, Confocal images showing the cleaved caspase‐3‐immunoreactive neurons (green) after treatment with recombinant human LCN2 protein (2 μg/mL). Nuclei were labeled with DAPI (blue). Scale bars, 25 μm
FIGURE 10
FIGURE 10
A proposed model depicting the role of LCN2 in neural transplantation. Transplantation of post‐mitotic neurons (green) in the brain recruits and activates resident microglia (yellow), peripheral immune cells (red), and astrocytes (purple and pink). Hypoxia and anoikis cause cell death in the core of engrafted neurons (grey). Activated astrocytes are broadly distributed around the graft site, while the activated microglia are recruited to the core of graft. LCN2 is induced in a subset of reactive astrocytes infiltrating in the engrafted site (pink). LCN2‐immunoreactive astrocytes express lower levels of A1 and A2 astrocytic markers (C3 and S100A10). LCN2 (cyan), released from reactive astrocytes and internalized by BOCT (black), induces apoptosis of engrafted neurons, possibly through intracellular iron sequestration

References

    1. Bonnamain V, Neveu I, Naveilhan P. Neural stem/progenitor cells as a promising candidate for regenerative therapy of the central nervous system. Front Cell Neurosci. 2012;6:17. - PMC - PubMed
    1. Grade S, Gotz M. Neuronal replacement therapy: previous achievements and challenges ahead. NPJ Regen Med. 2017;2:29. - PMC - PubMed
    1. Hoornaert CJ, Le Blon D, Quarta A, et al. Concise review: innate and adaptive immune recognition of allogeneic and xenogeneic cell transplants in the central nervous system. Stem Cells Transl Med. 2017;6:1434‐1441. - PMC - PubMed
    1. Piquet AL, Venkiteswaran K, Marupudi NI, Berk M, Subramanian T. The immunological challenges of cell transplantation for the treatment of Parkinson's disease. Brain Res Bull. 2012;88:320‐331. - PMC - PubMed
    1. Enderby C, Keller CA. An overview of immunosuppression in solid organ transplantation. Am J Manag Care. 2015;21:s12‐s23. - PubMed

Publication types

MeSH terms

LinkOut - more resources