. 2021 Apr;160(5):1662-1678.e18.
doi: 10.1053/j.gastro.2020.12.062. Epub 2021 Jan 7.

miR-10b-5p Rescues Diabetes and Gastrointestinal Dysmotility

Affiliations

miR-10b-5p Rescues Diabetes and Gastrointestinal Dysmotility

Rajan Singh et al. Gastroenterology. 2021 Apr.

Abstract

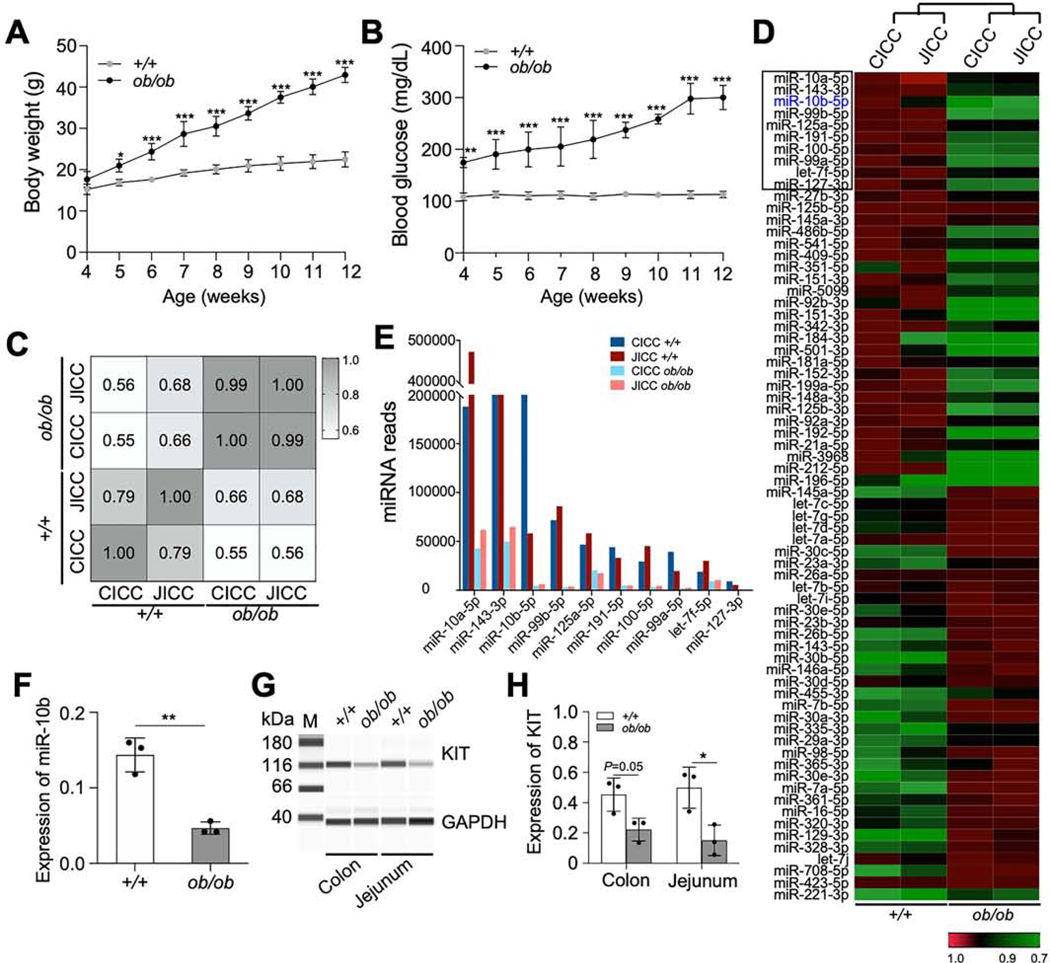
Background & aims: Interstitial cells of Cajal (ICCs) and pancreatic β cells require receptor tyrosine kinase (KIT) to develop and function properly. Degeneration of ICCs is linked to diabetic gastroparesis. The mechanisms linking diabetes and gastroparesis are unclear, but may involve microRNA (miRNA)-mediated post-transcriptional gene silencing in KIT+ cells.

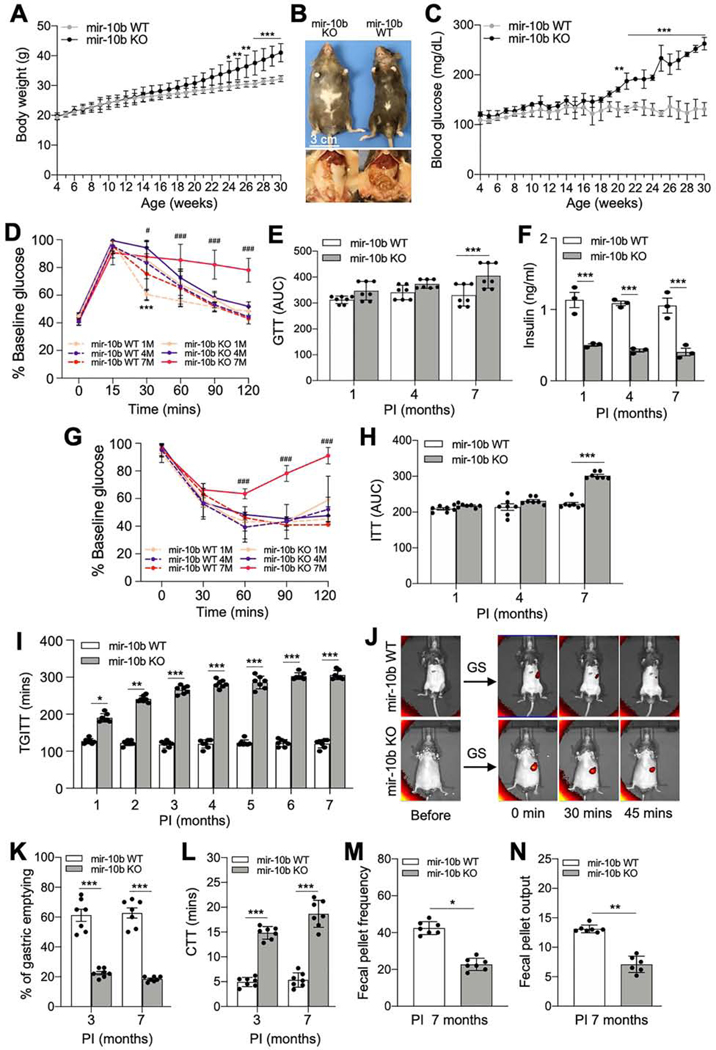
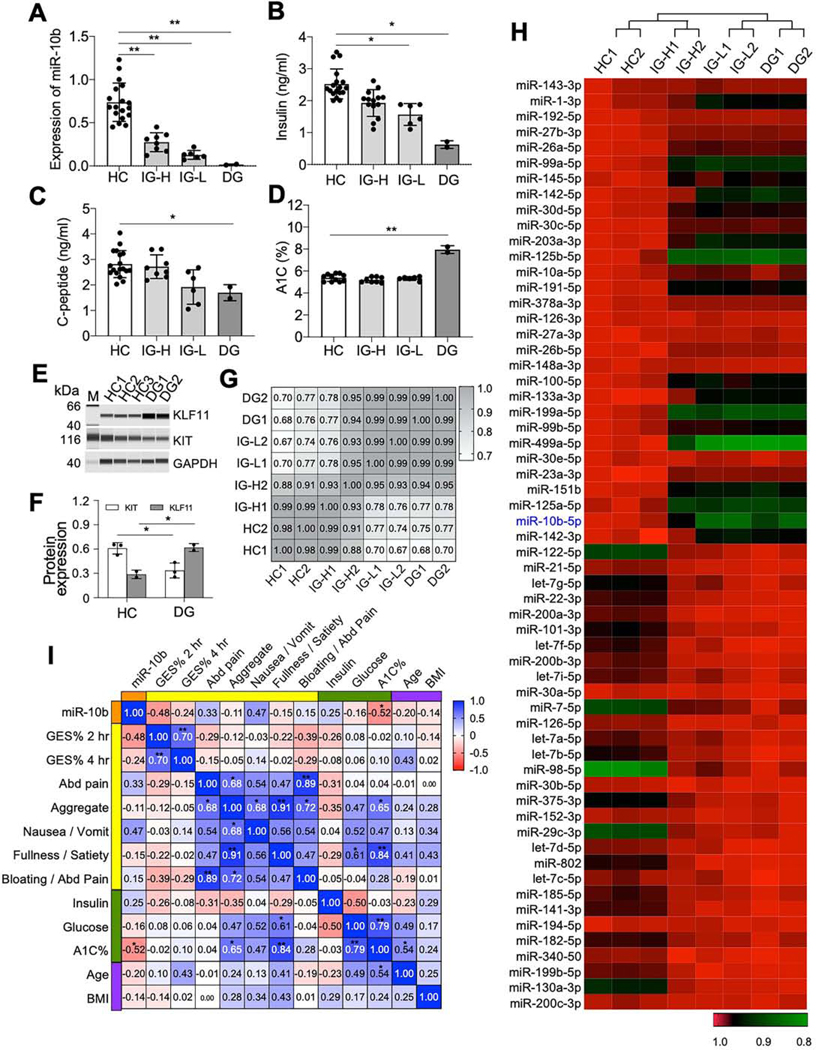
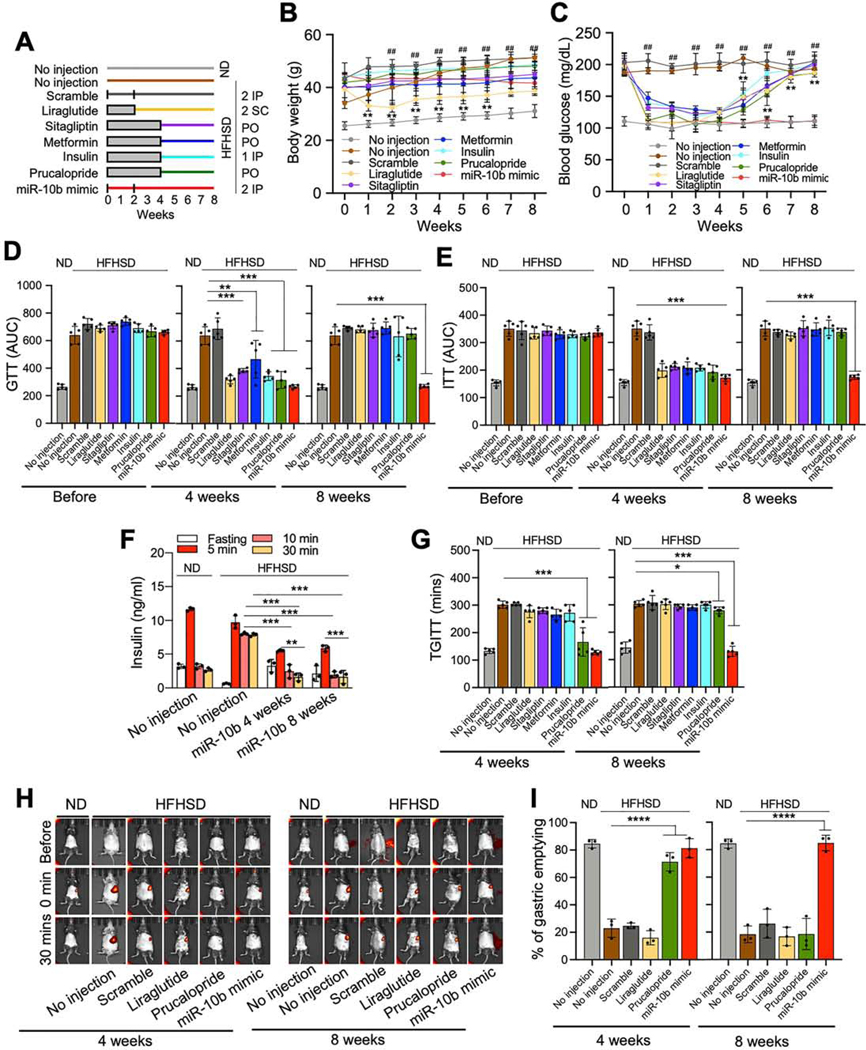
Methods: We performed miRNA-sequencing analysis from isolated ICCs in diabetic mice and plasma from patients with idiopathic and diabetic gastroparesis. miR-10b-5p target genes were identified and validated in mouse and human cell lines. For loss-of-function studies, we used KIT+ cell-restricted mir-10b knockout mice and KIT+ cell depletion mice. For gain-of-function studies, a synthetic miR-10b-5p mimic was injected in multiple diabetic mouse models. We compared the efficacy of miR-10b-5p mimic treatment vs antidiabetic and prokinetic medicines.

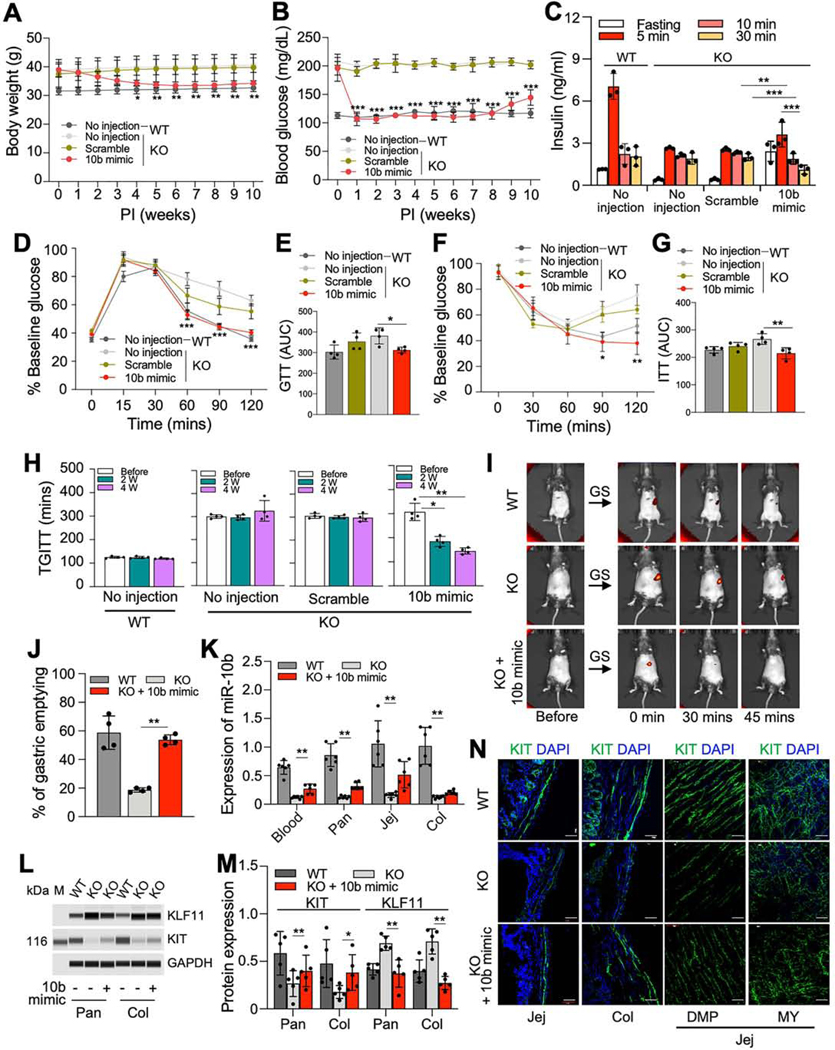
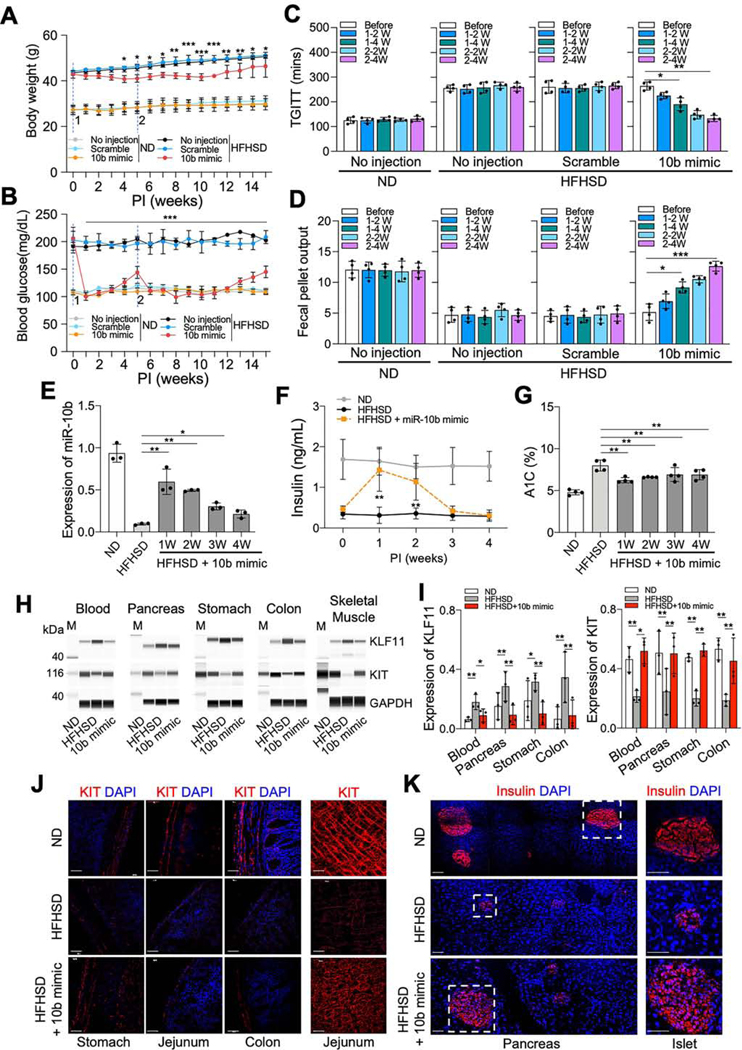
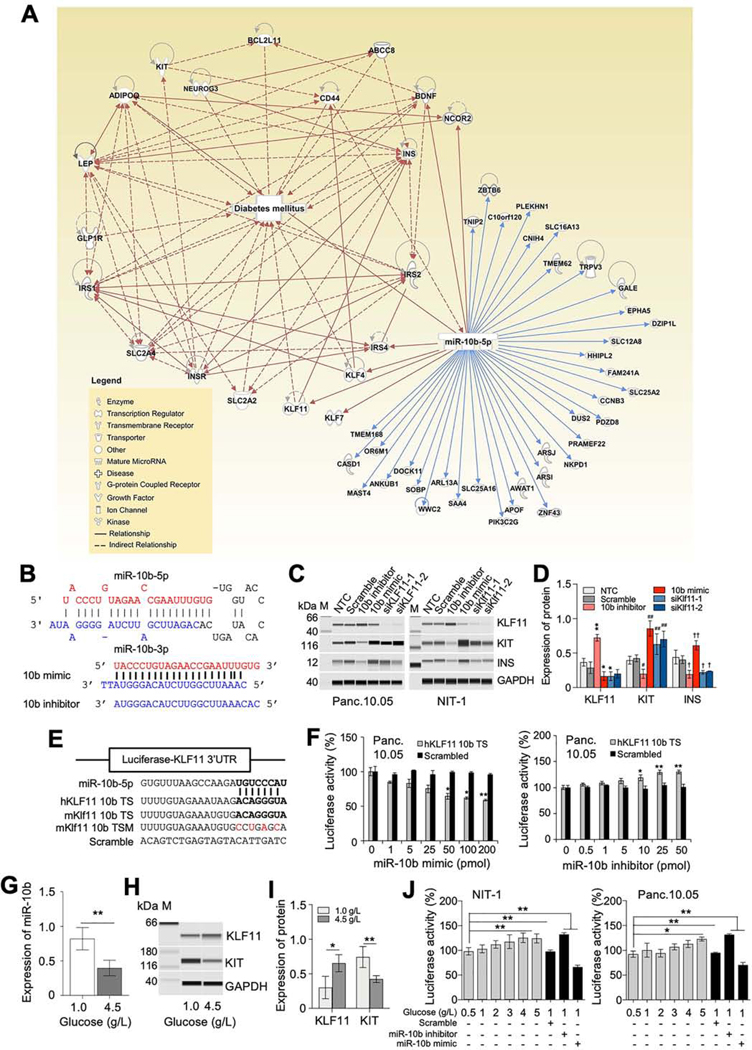
Results: miR-10b-5p is highly expressed in ICCs from healthy mice, but drastically depleted in ICCs from diabetic mice. A conditional knockout of mir-10b in KIT+ cells or depletion of KIT+ cells in mice leads to degeneration of β cells and ICCs, resulting in diabetes and gastroparesis. miR-10b-5p targets the transcription factor Krüppel-like factor 11 (KLF11), which negatively regulates KIT expression. The miR-10b-5p mimic or Klf11 small interfering RNAs injected into mir-10b knockout mice, diet-induced diabetic mice, and TALLYHO polygenic diabetic mice rescue the diabetes and gastroparesis phenotype for an extended period of time. Furthermore, the miR-10b-5p mimic is more effective in improving glucose homoeostasis and gastrointestinal motility compared with common antidiabetic and prokinetic medications.

Conclusions: miR-10b-5p is a key regulator in diabetes and gastrointestinal dysmotility via the KLF11-KIT pathway. Restoration of miR-10b-5p may provide therapeutic benefits for these disorders.

Keywords: Diabetic Gastroparesis; Gastrointestinal Dysmotility; Interstitial Cells of Cajal; MicroRNAs; Pancreatic β Cells.


Conflict of interest statement

Conflict of interest statement (for all authors)

A provisional patent application entitled “miR-10b mimics and targets thereof for use in the treatment of diabetes and gastrointestinal motility disorders” has been filed by S.R. and the University of Nevada Reno Office of Technology Transfer (serial no. 62/837,988, filed April 24 2019).

Figures

Figure 1.
Figure 1.
Expression of miR-10b-5p is drastically reduced in KIT+-ICCs in male diabetic KitcopGFP/+;Lepob/ob Mice. (A, B) Body weight and fasting blood glucose levels of KitcopGFP/+;Lep+/+ (+/+) and KitcopGFP/+;Lepob/ob (ob/ob) mice (Two-way ANOVA, n=8). (C) Pearson correlation analysis between miRNA-seq data obtained from colonic and jejunal ICC (CICC and JICC, respectively) isolated and pooled from diabetic ob/ob (n=30) and +/+ mice (n=20). (D) Heat map of the 70 most dynamically regulated miRNAs in CICC and JICC of diabetic ob/ob mice. (E) Expression levels of the ten most prominently reduced miRNAs in CICC and JICC of diabetic ob/ob mice from panel E (black box) obtained by miRNA-seq (n=20–30). (F) Expression of miR10b-5p in gastric ICCs of +/+ and ob/ob mice measured by qPCR (n=3). (G, H) Western blot and quantification of KIT in the jejunum and colon of +/+ and ob/ob mice (n=3). Error bar indicate SEM, unpaired t-test. *p < 0.05, **p < 0.01.
Figure 2.
Figure 2.
Male KIT+ cell-specific mir-10b KO mice develop diabetes and GI dysmotility. KitCreERT2/+;mir-10blox/lox mice were injected with tamoxifen (mir-10b KO) or oil (mir-10b WT) at 4-weeks of age. (A) Body weight of mir-10b KO and WT male mice. (B) Gross anatomical images of 30-weeks old male mir-10b KO and WT mice. (C) Fasting blood glucose levels in mir-10b KO and WT male mice. (D) Glucose tolerance tests (GTT) in mir-10b KO and WT male mice. (E) GTT plot of the area under the curve (AUC) from (D). (F) Changes in blood insulin levels after 6-hrs fasting in mir-10b KO and WT male mice (n=3). (G) Insulin tolerance test (ITT) in mir-10b KO and WT male mice. (H) ITT plot of the AUC from (G). (I) Total GI transit time (TGITT). (J) Gastric emptying images of 7-month-old mir-10b KO and WT mice. (K) Quantification of gastric emptying at 30-min. (L) Colonic transit time (CTT). (M, N) Fecal pellet frequency and output within 24-hrs. (unpaired t-test). n=7 per condition for each experiment. Error bar indicate SEM, Two-way ANOVA. *p < 0.05, **p < 0.01, ***p < 0.001, ††p < 0.01, #p < 0.05, ###p < 0.001.
Figure 3.
Figure 3.
miR-10b-5p mimic injection rescues the diabetic and GI dysmotility phenotypes in male mir-10b KO mice. Male diabetic mir-10b KO mice were injected with miR-10b-5p (10b mimic), a negative control (scramble RNA), or given no injection, compared to WT mice. (A, B) Body weight and fasting blood glucose levels for 10-weeks post-injection (PI). (C) Comparison of insulin levels after 6-hrs fasting and after glucose injection in mir-10b KO and WT mice at 1-week post-injection (IP) (One-way ANOVA). (D and F) GTT and ITT at 1-week PI. (E and G) GTT and ITT plot of the AUC from (D and F) (One-way ANOVA). (H, I) TGITT (One-way ANOVA) at 2- and 4-weeks PI and gastric emptying test at 4-weeks PI. (J) Quantification of gastric emptying at 30-min (One-way ANOVA). (K) Quantification of miR-10b-5p in the blood, pancreas, jejunum, and colon in male WT and diabetic mir-10b KO mice 1-week after 10b mimic or no injection measured by qPCR (One-way ANOVA). (L, M) Western blot and quantification of KLF11 and KIT in the pancreas and colon in male WT and diabetic mir-10b KO mice 1-week after 10b mimic or no injection (One-way ANOVA). (N) Images of cross sections and whole mount tissue sections showing the restoration of ICCs (KIT+) in the jejunum and colon at 1-week PI. Scale bars are 50 μm. n=3–4 per condition for each experiment. Pan, pancreas; Col, colon; Jej, jejunum; DMP, deep muscular plexus; MY, myenteric plexus. Error bar indicate SEM, Two-way ANOVA (A-D). *p < 0.05, **p < 0.01, ***p < 0.001.
Figure 4.
Figure 4.
miR-10b-5p mimic rescues the diabetic and GI dysmotility phenotypes in male HFHSD-fed mice. Male C57 mice (at 4-weeks of age) were fed a HFHSD (diabetic) or ND (healthy controls) for 4-months and injected twice (second injection at 5-weeks) with either the miR-10b-5p mimic (10b mimic), a negative control (scramble RNA), or given no injection, over a 10-week period. (A, B) Body weight and fasting blood glucose level comparison (Two-way ANOVA). (C, D) TGITT and fecal pellet output. (E) Expression of miR-10b-5p in the blood from ND-fed healthy mice, HFHSD-fed diabetic mice, and 10b mimic-injected HFHSD-fed mice at 1–4 weeks PI measured by qPCR. (F) Changes in insulin levels (6-hrs fasting) and A1C levels in male mice fed a HFHSD or ND and injected with 10b mimic (Two-way ANOVA). (G) Changes in A1C levels in male mice fed a HFHSD or ND and injected with 10b mimic. (H, I) Western blot and quantification of KLF11 and KIT in blood, pancreas, stomach, colon and skeletal muscle from ND, HFHSD, and 10b mimic-injected HFHSD-fed mice at 3-weeks PI. (J, K) Images of cross sections and whole mount tissue sections showing the restoration of ICCs (KIT+) in the stomach, jejunum, and colon, as well as in β cells (Insulin+) in the pancreatic islets at 3-weeks PI. Scale bars are 100 μm. n=3–4 per condition for each experiment. Error bar indicate SEM, One-way ANOVA. *p < 0.05, **p < 0.01, ***p < 0.001.
Figure 5.
Figure 5.
Target identification and validation of miR-10b-5p in vitro. (A) Pathway analysis of miR-10b-5p and its target genes associated with diabetes mellitus according to Ingenuity Pathway Analysis. (B) The sequence and structure of the mouse miR-10b precursor (pre-miR10b) encoding miR-10b-5p and miR-10b-3p, a synthetic miR-10b-5p molecule (miR-10b-5p mimic) and a synthetic miR-10b-5p antisense molecule (miR-10b-5p inhibitor). (C) Targeting of KLF11, KIT and INS by the miR-10b-5p mimic, miR-10b-5p inhibitor, and KLF11 siRNAs (siKLF11–1 and siKLF11–2 in human Panc.10.05 cells and siKlf11–1 and siKlf11–2 in mouse NIT-1 cells). A non-targeting (scramble) RNA and non-transfection control (NTC) were used as negative controls. A protein marker (M) with corresponding molecular weights (kDa) is shown. (D) Quantification of protein expression levels of KLF11, KIT and INS in Panc.10.05 cells. (E) Diagram of luciferase reporter plasmids with the miR-10b-5p target site (miR-10b-5p mimic binding site) of human and mouse KLF11 (hKLF11 10b TS and mKlf11 10b TS) and a mutant (mKlf11 10b TSM). (F) Target validation of KLF11 with the miR-10b-5p mimic and miR-10b-5p inhibitor in Panc.10.05 cells transfected with luciferase reporter plasmids (Two-way ANOVA). (G) Quantification of miR-10b-5p in NIT-1 cells incubated in media with different glucose concentrations (0, 1.0, and 4.5 mg/L). (H and I) Western blot and quantification of KLF11 and KIT expression at different glucose concentrations. (J) Target effects of KLF11 in NIT-1 and Panc.10.05 cells cultured at different glucose concentrations. n=3 per condition for each experiment. Error bar indicate SEM, One-way ANOVA. *p < 0.05, **p < 0.01.
Figure 6.
Figure 6.
Validation of altered expression of miR-10b-5p, KLF11, and KIT in patients with idiopathic and diabetic gastroparesis. (A) Expression of miR-10b-5p in blood samples collected from idiopathic gastroparesis patients (IG, n=14) and diabetic gastroparesis patients (DG, n=2) compared to healthy control subjects (HC, n=18). The IG group was divided into two groups with high miR-10b levels (IG-H, n=8) or low miR-10b levels (IG-L, n=6). (B-D) Comparison of insulin, C-peptide and A1C levels in the blood of the four groups. (E) Western blot of KLF11 and KIT in the blood samples of the HC and DG groups. (F) Pearson correlation analysis between miRNA-seq data obtained from the blood of HC, IG-H, IG-L, and DG (n=2). (G) Heat map of 70 most dynamically regulated miRNAs in blood plasma samples from HC, IG-H, IG-L, and DG (n=2). (H) The Spearman rank correlation between miR-10b-5p expression levels and metabolic parameters, clinical GI symptoms, and gastric emptying scintigraphy (GES) % at 2- and 4-hrs in gastroparesis. Error bar indicate SEM, One-Way ANOVA. *p < 0.05, **p < 0.01.
Figure 7.
Figure 7.
Efficacy comparison of miR-10b-5p mimic with antidiabetic and prokinetic medicines in HFHSD-fed diabetic C57 male mice. (A) A study design of drug effects in HFHSD-fed diabetic mice- or ND-fed healthy mice. miR-10b-5p, or scramble RNA were injected twice, at 0- and 2weeks by IP injection; Metformin or Sitagliptin was provided daily PO for 4-weeks; Liraglutide was injected twice daily by SC injection for 2-weeks; Insulin was injected once daily by IP injection for 4-weeks; Prucalopride was provided daily PO for 4-weeks. (B, C) Body weight and fasting blood glucose levels for 8-weeks post treatment (Two-way ANOVA, n=5). (D, E) Comparison of GTT and ITT plot of AUC (n=5). (F) Comparison of insulin levels at 6-hrs fasting and after glucose injection (n=3). (G) TGITT comparison (n=5). (H, I) Gastric emptying images and quantification of stomach emptying (n=3). Error bar indicate SEM, One-way ANOVA. *p < 0.05, **p < 0.01, ***p < 0.001, ****p < 0.0001, #p < 0.05, ##p < 0.01.

References

    1. Cho NH, Shaw JE, Karuranga S, et al. IDF Diabetes Atlas: Global estimates of diabetes prevalence for 2017 and projections for 2045. Diabetes Res Clin Pract 2018;138:271–281. - PubMed
    1. Holman N, Young B, Gadsby R. Current prevalence of Type 1 and Type 2 diabetes in adults and children in the UK. Diabet Med 2015;32:1119–20. - PubMed
    1. Halban PA, Polonsky KS, Bowden DW, et al. beta-cell failure in type 2 diabetes: postulated mechanisms and prospects for prevention and treatment. Diabetes Care 2014;37:1751–8. - PMC - PubMed
    1. Eizirik DL, Pasquali L, Cnop M. Pancreatic beta-cells in type 1 and type 2 diabetes mellitus: different pathways to failure. Nat Rev Endocrinol 2020;16:349–362. - PubMed
    1. Cherney DZI, Lam TKT. A Gut Feeling for Metformin. Cell Metab 2018;28:808–810. - PubMed

Publication types

MeSH terms