Review
. 2021 Jan:63:103200.
doi: 10.1016/j.ebiom.2020.103200. Epub 2021 Jan 6.

Childhood-onset genetic cone-rod photoreceptor diseases and underlying pathobiology

Affiliations
Review

Childhood-onset genetic cone-rod photoreceptor diseases and underlying pathobiology

Alexandra V Garafalo et al. EBioMedicine. 2021 Jan.

Abstract

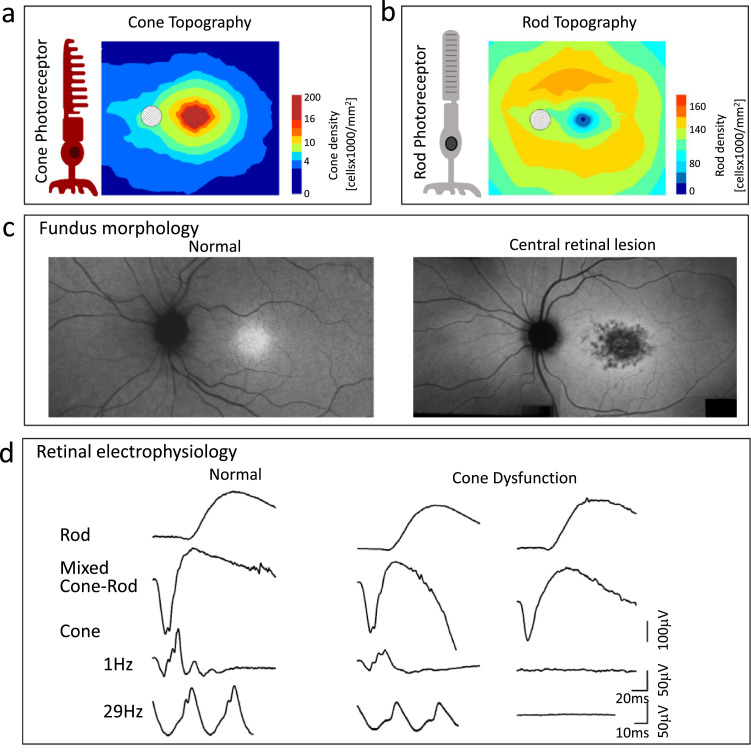
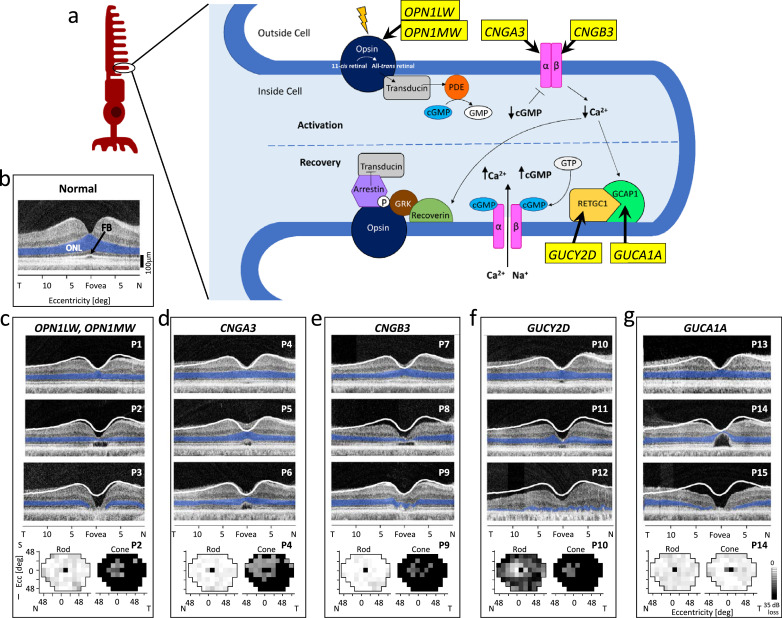
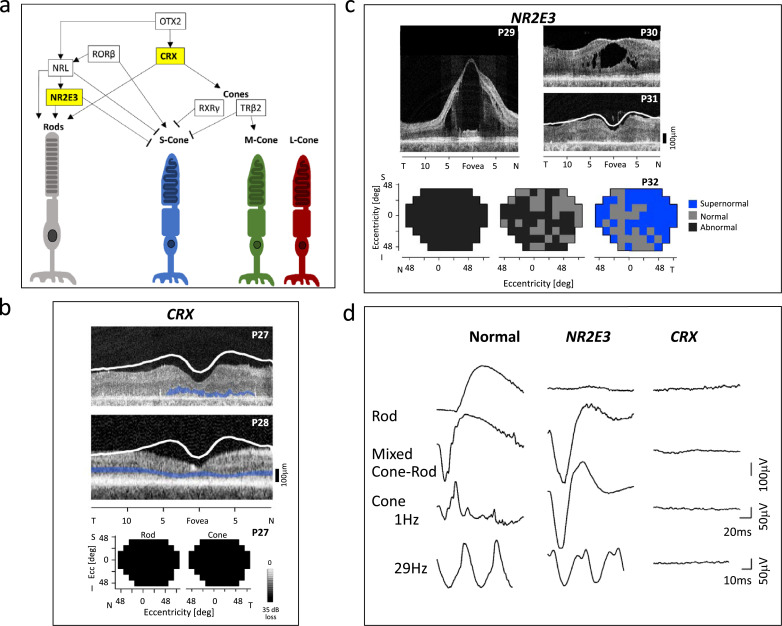
Inherited retinal diseases (IRDs) were first classified clinically by history, ophthalmoscopic appearance, type of visual field defects, and electroretinography (ERG). ERGs isolating the two major photoreceptor types (rods and cones) showed some IRDs with greater cone than rod retinal dysfunction; others were the opposite. Within the cone-rod diseases, there can be phenotypic variability, which can be attributed to genetic heterogeneity and the variety of visual function mechanisms that are disrupted. Most cause symptoms from childhood or adolescence, although others can manifest later in life. Among the causative genes for cone-rod dystrophy (CORD) are those encoding molecules in phototransduction cascade activation and recovery processes, photoreceptor outer segment structure, the visual cycle and photoreceptor development. We review 11 genes known to cause cone-rod disease in the context of their roles in normal visual function and retinal structure. Knowledge of the pathobiology of these genetic diseases is beginning to pave paths to therapy.

Keywords: Genotype; Phenotype; Photoreceptor; Retina; Vision.


Conflict of interest statement

Declaration of Competing Interest The authors declare no competing interests or conflicts of interest.

Figures

Fig 1
Fig. 1
Photoreceptor topography and CORD clinical diagnostics. (a) Cone photoreceptor diagram and cone ONL thickness topography based on photoreceptor density map . (b) Rod diagram and rod ONL thickness topography based on photoreceptor density map . (c) En face near-infrared autofluorescence image showing normal fundus appearance (left), and central retinal lesion in a patient with ABCA4-retinopathy (right). (d) Retinal electrophysiology, specifically standard rod and cone ERGs, in a normal subject (left) and two patients with normal rod but reduced (middle) or non-detectable (right) cone signals. (For interpretation of the references to color in this figure legend, the reader is referred to the web version of this article.)
Fig 2
Fig. 2
Phototransduction activation and recovery. (a) Overview of the normal phototransduction pathway occurring in photoreceptor OS disks. Key proteins are depicted, and associated genes that are discussed in this review are given in yellow boxes. A photon of light hits the opsin molecule and 11-cis-retinal is converted to all-trans retinal. Transducin is activated, which in turn activates a phosphodiesterase (PDE) which hydrolyzes cGMP. Reduction in intracellular cGMP results in closure of cGMP-gated ion channels, and subsequent reduction of intracellular Ca2+ culminates in the hyperpolarization of the photoreceptor. Low intracellular Ca2+ promotes recovery in two ways. Reduced Ca2+levels cause GCAP1 to activate RETGC1 to synthesize cGMP. Increased levels of cGMP cause cGMP-gated ion channels to reopen and the cell to become depolarized. Low Ca2+ levels also facilitate activation of recoverin, which allows G-protein coupled receptor kinases (GRK) to phosphorylate (P) the activated opsin. Arrestin then binds to the phosphorylated opsin, blocking its ability to further activate transducin, turning off the transduction. (b) OCT across the horizontal meridian through the fovea with highlighted (blue) ONL in a normal subject. FB, foveal bulge. (c-g) OCTs of patients representing each of the 5 genotypes causing abnormalities in phototransduction activation and recovery. White lines represent the lower limit of normal retinal thickness (−2 standard deviations from mean); ONL is highlighted in blue. At the bottom of each panel are rod (left) and cone (right) perimetry maps for patients with the genotype. N, nasal; T, temporal. (For interpretation of the references to color in this figure legend, the reader is referred to the web version of this article.)
Fig 3
Fig. 3
Photoreceptor outer segment structure. (a) Structural elements of the photoreceptor OS are depicted with associated genes given in yellow boxes. (b-d) OCTs of 2 patients representing each of the 3 genotypes causing abnormalities in photoreceptor OS structure. ONL is highlighted in blue; lower limit of normal retinal thickness is demarcated by white lines. At the bottom of each panel are rod (left) and cone (right) perimetry maps for a patient with the genotype. (For interpretation of the references to color in this figure legend, the reader is referred to the web version of this article.)
Fig 4
Fig. 4
Visual cycle and ABCA4 retinopathy. (a) Schematic of a photoreceptor OS disk and location of ABCA4 molecules. Normal function of ABCA4 in the visual cycle is shown. 11-cis retinal is isomerized to all-trans retinal which dissociates from opsin. A portion of the all-trans retinal can diffuse from the inner disk membrane to the cytoplasmic side of the membrane, and the remainder binds to phosphatidylethanolamine (PE) to form N-trans-retinylidene-PE (N-t-R-PE) in the inner leaflet of the disk membrane. ABCA4 flips the N-t-R-PE from the intradiscal side of the membrane to the cytoplasmic side where PE then dissociates from all-trans retinal, and all-trans retinal can enter the visual cycle pathway. (b) Ultra-wide-angle en face near-infrared (NIR) autofluorescence image of right eye of a 21-yr-old ABCA4-retinopathy patient (P23); inset (defined on larger image by black box): short-wavelength (SW) autofluorescence image showing lipofuscin accumulation. (c) Upper 3 panels: OCTs of 3 patients with ABCA4 mutations illustrating (top to bottom) different degrees of central photoreceptor loss. ONL is highlighted in blue, white lines represent lower limit of normal retinal thickness. Lower: Rod (left) and cone (right) perimetry maps for 2 ABCA4 patients. (For interpretation of the references to color in this figure legend, the reader is referred to the web version of this article.)
Fig 5
Fig. 5
Photoreceptor development. (a) A simplified depiction of the regulatory network that governs photoreceptor differentiation. OTX2, CRX and RORβ act to promote both rod and cone differentiation. NRL and NR2E3 promote rod-specific gene expression and NR2E3 also suppresses S-cone-specific gene expression. TRβ2 promotes M-cone-specific gene expression and works with RXRγ to suppress S-cone-specific gene expression ,,. Yellow boxes indicate the 2 development genes discussed in this review. (b) OCTs of 2 patients with a CRX mutation causing LCA (P27) and dominant CORD (P28) and maps showing no measurable rod and cone function in the LCA patient. ONL is highlighted in blue; lower limit of normal retinal thickness is marked with the white line. (c) OCTs across the horizontal meridian through the fovea of 3 patients with NR2E3 mutations. Maps of the visual field of an NR2E3 patient illustrating abnormal rod function (left), abnormal and normal loci of L/M cone function (middle), and supernormal and normal loci of S-cone function. (d) Comparison of ERGs in a normal subject, an NR2E3 patient and a CRX patient. (For interpretation of the references to color in this figure legend, the reader is referred to the web version of this article.)

References

    1. Curcio C.A., Sloan K.R., Kalina R.E., Hendrickson A.E. Human photoreceptor topography. J Comp Neurol. 1990;292(4):497–523. - PubMed
    1. Müller H. Über einige Verhältnisse der Netzhaut bei Menschen und Tieren. Verhandlungen der Physikalisch-Medizinischen Gesellschaft zu Würzburg. 1854;4:96–100.
    1. Schultze M.J. Max Cohen; Bonn: 1866. Über den gelben fleck der retina, seinen einfluss auf normales Sehen und auf Farbenblindheit.
    1. Cajal S.R. La rétine des vertébrés. Cellule. 1893;9:119–257.
    1. Wässle H., Boycott B.B. Functional architecture of the mammalian retina. Physiol Rev. 1991;71(2):447–480. - PubMed