. 2021 Jan 9;13(1):20.
doi: 10.1186/s13195-020-00741-z.

Metabolic phenotyping reveals a reduction in the bioavailability of serotonin and kynurenine pathway metabolites in both the urine and serum of individuals living with Alzheimer's disease

Collaborators, Affiliations

Metabolic phenotyping reveals a reduction in the bioavailability of serotonin and kynurenine pathway metabolites in both the urine and serum of individuals living with Alzheimer's disease

Luke Whiley et al. Alzheimers Res Ther. .

Abstract

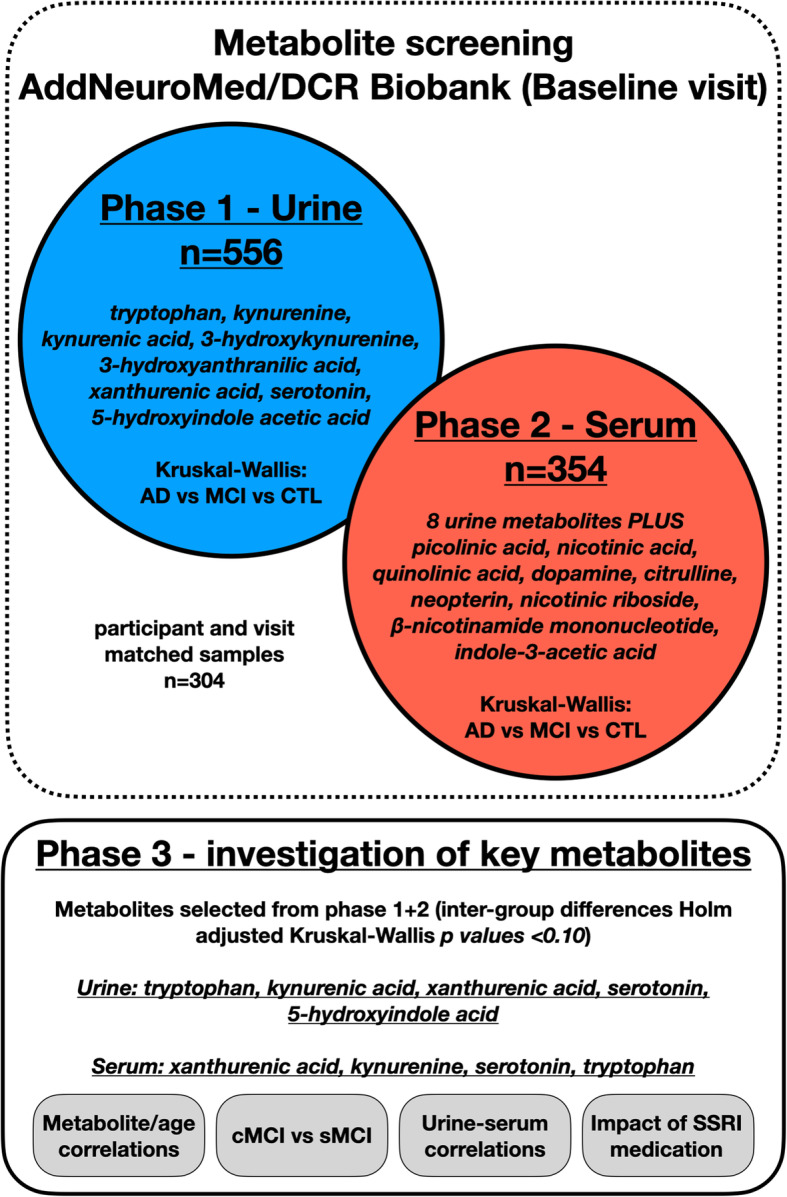
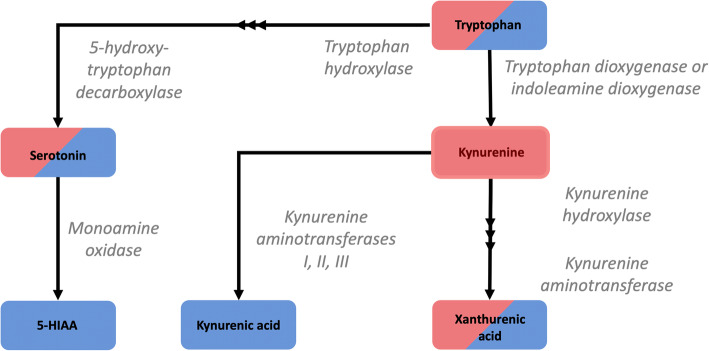
Background: Both serotonergic signalling disruption and systemic inflammation have been associated with the pathogenesis of Alzheimer's disease (AD). The common denominator linking the two is the catabolism of the essential amino acid, tryptophan. Metabolism via tryptophan hydroxylase results in serotonin synthesis, whilst metabolism via indoleamine 2,3-dioxygenase (IDO) results in kynurenine and its downstream derivatives. IDO is reported to be activated in times of host systemic inflammation and therefore is thought to influence both pathways. To investigate metabolic alterations in AD, a large-scale metabolic phenotyping study was conducted on both urine and serum samples collected from a multi-centre clinical cohort, consisting of individuals clinically diagnosed with AD, mild cognitive impairment (MCI) and age-matched controls.

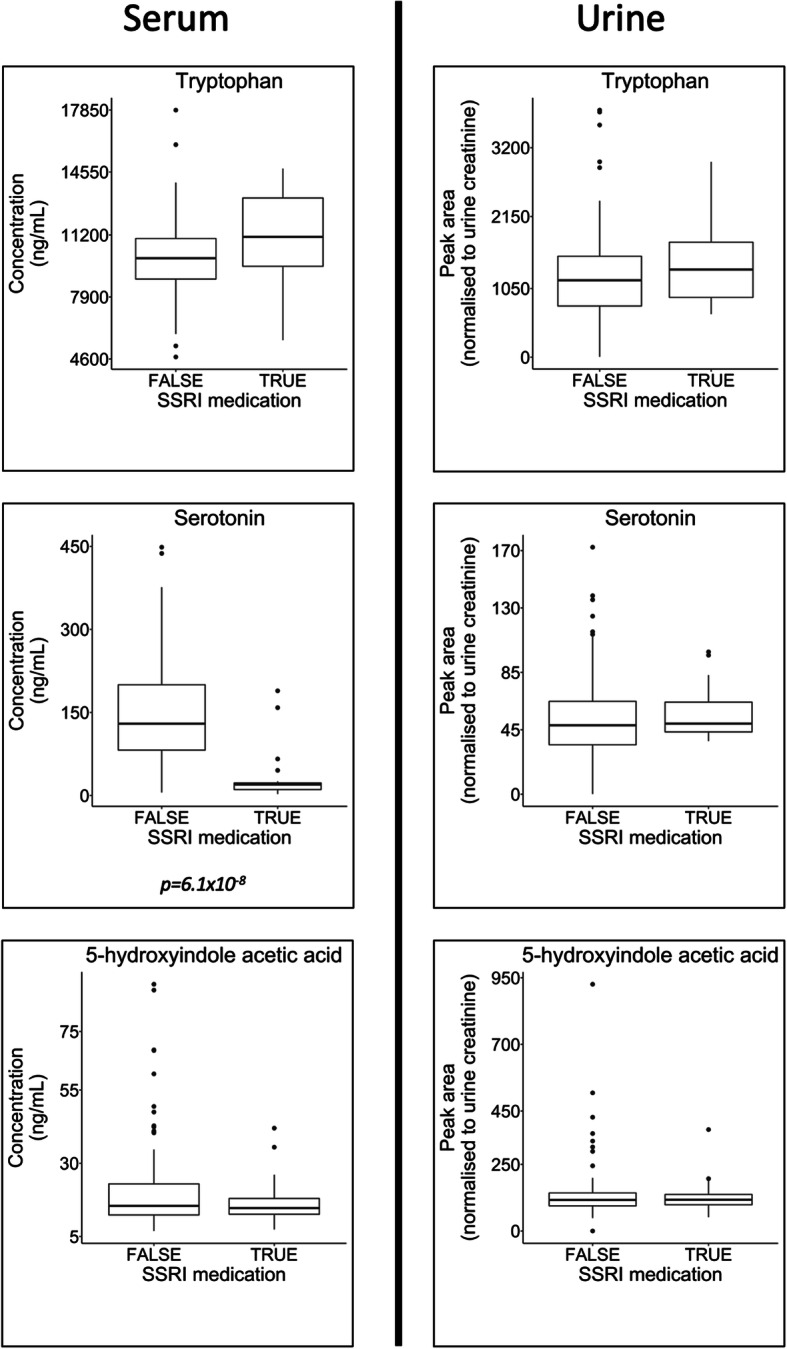
Methods: Metabolic phenotyping was applied to both urine (n = 560) and serum (n = 354) from the European-wide AddNeuroMed/Dementia Case Register (DCR) biobank repositories. Metabolite data were subsequently interrogated for inter-group differences; influence of gender and age; comparisons between two subgroups of MCI - versus those who remained cognitively stable at follow-up visits (sMCI); and those who underwent further cognitive decline (cMCI); and the impact of selective serotonin reuptake inhibitor (SSRI) medication on metabolite concentrations.

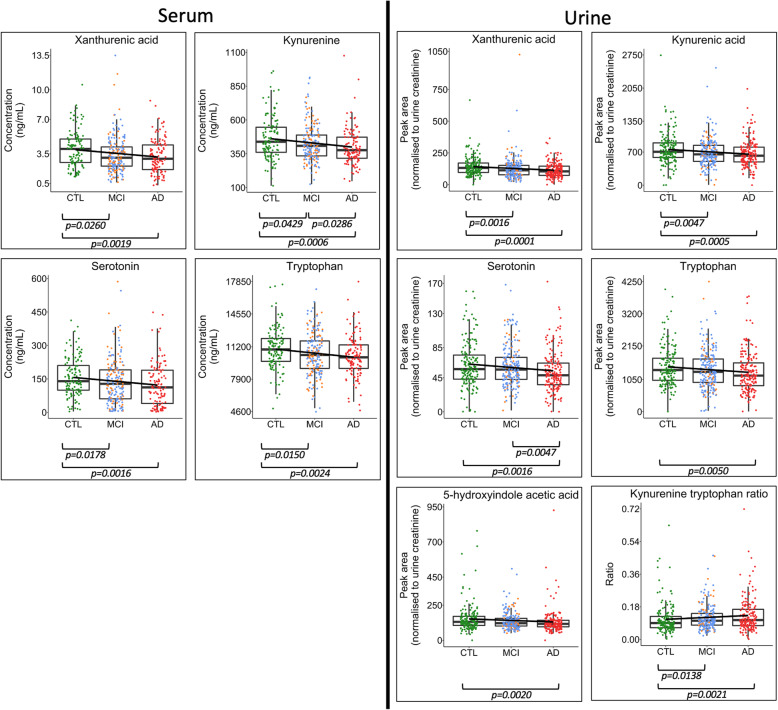
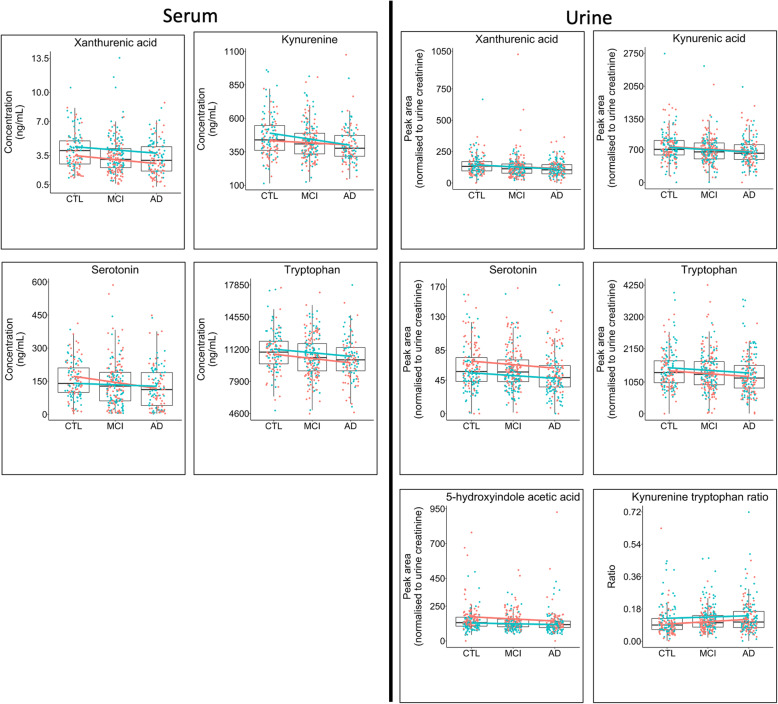
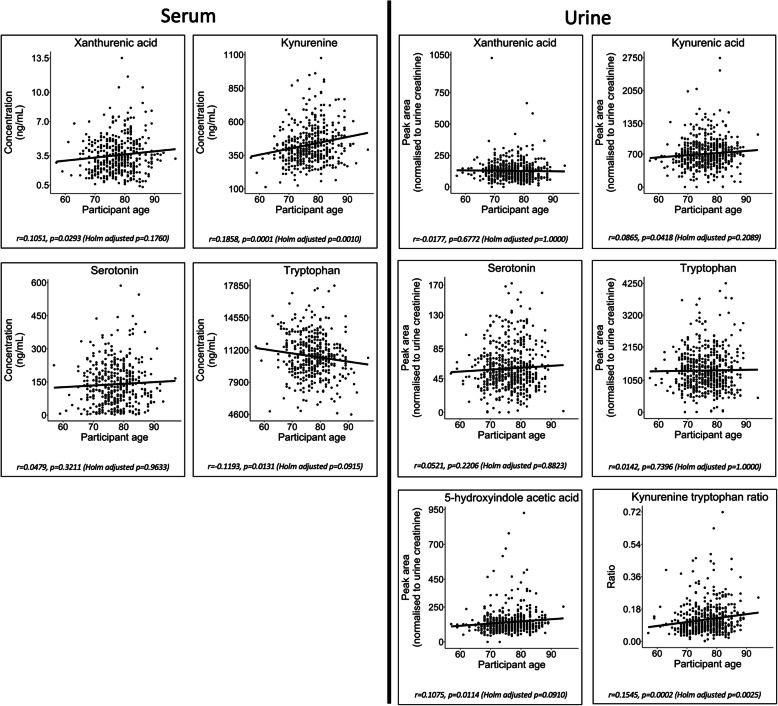
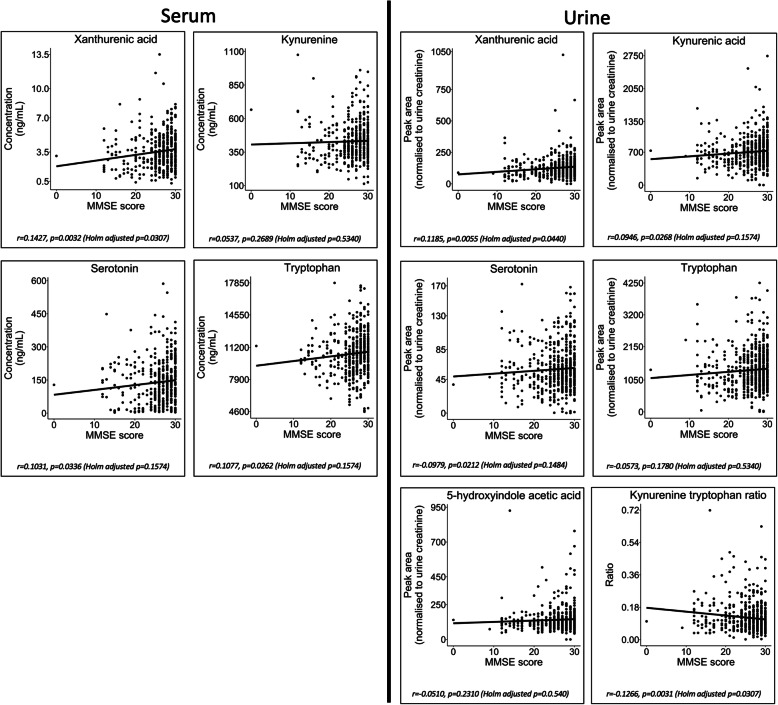
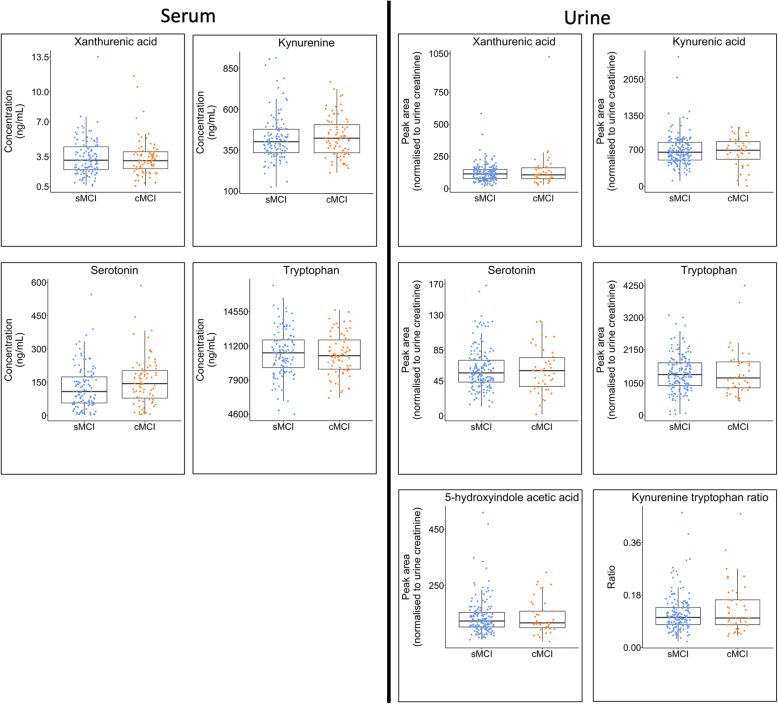
Results: Results revealed significantly lower metabolite concentrations of tryptophan pathway metabolites in the AD group: serotonin (urine, serum), 5-hydroxyindoleacetic acid (urine), kynurenine (serum), kynurenic acid (urine), tryptophan (urine, serum), xanthurenic acid (urine, serum), and kynurenine/tryptophan ratio (urine). For each listed metabolite, a decreasing trend in concentrations was observed in-line with clinical diagnosis: control > MCI > AD. There were no significant differences in the two MCI subgroups whilst SSRI medication status influenced observations in serum, but not urine.

Conclusions: Urine and serum serotonin concentrations were found to be significantly lower in AD compared with controls, suggesting the bioavailability of the neurotransmitter may be altered in the disease. A significant increase in the kynurenine/tryptophan ratio suggests that this may be a result of a shift to the kynurenine metabolic route due to increased IDO activity, potentially as a result of systemic inflammation. Modulation of the pathways could help improve serotonin bioavailability and signalling in AD patients.

Keywords: Alzheimer’s disease; Kynurenine; Mass spectrometry; Metabolic phenotyping; Serotonergic signalling; Serotonin; Systemic inflammation; Tryptophan.


Conflict of interest statement

The authors declare that they have no competing interests.

Figures

Fig. 1
Fig. 1
Study workflow. An overview of the study design and overall workflow
Fig. 2
Fig. 2
Inter-group metabolite differences. Boxplots highlighting differences between metabolite concentrations in serum and urine when comparing AD (red), MCI (blue = sMCI, yellow = cMCI) and age-matched controls (CTL—green). Boxplots are shown for metabolites in the serotonin and kynurenine pathways that reported significant differences following univariate Kruskal-Wallis tests. Figure p values were calculated using Dunn’s post hoc test for those metabolites that reported a Kruskal-Wallis p value < 0.1 following adjustment for multiple testing using the Holm method. A decreasing trend was observed: control > MCI > AD for each metabolite. This trend was observed regardless of gender (Fig. 3). Boxplots for all metabolites are presented in Fig. S1 and S2
Fig. 3
Fig. 3
Inter-group metabolite differences stratified by gender. Boxplots highlighting differences between metabolite concentrations in serum when comparing Alzheimer’s disease (AD), mild cognitive impairment (MCI) and age-matched controls (CTL). Boxplots were fitted with a linear model coloured by gender (red = female, blue = male). Boxplots are shown for the metabolites in the serotonin and kynurenine pathways that reported significant differences between participant groups (Supplementary Figs. S1 and S2). The plots suggest that the observed lower concentrations in metabolites between groups CTL > MCI > AD follow a similar trend across both genders
Fig. 4
Fig. 4
Metabolite associations with participant age. Plots presenting metabolite concentration change in association with participant age. The plots were fitted with a linear regression model. Plots are shown for the metabolites in the serotonin and kynurenine pathways that reported significant differences between participant groups (Supplementary Figs. S1 and S2). The plots suggest that only serum tryptophan has a negative correlation with age—a major risk factor of AD (r = − 0.1193). The remaining key metabolites all have positive correlation with increased age; however, only serum kynurenine and urine kynurenic acid have a significant positive correlation (serum kynurenine: r = 0.1858, p = 0.0001 (Holm-adjusted p = 0.0009) and kynurenic acid: r = 0.0865, p = 0.0418 (Holm-adjusted p = 0.2089))
Fig. 5
Fig. 5
Serum and urine metabolite associations with participant MMSE scores. Plots presenting metabolite concentration change in association with participant Mini-Mental State Examination (MMSE) score. The plots were fitted with a linear regression model. Plots are shown for the metabolites in the serotonin and kynurenine pathways that reported significant differences between participant groups (Supplementary Figs. S1 and S2). The plots suggest that only urine xanthurenic acid has a significant negative correlation with participant MMSE (r = − 0.1266, p = 0.0031 (Holm-adjusted p = 0.0307)). A significant positive correlation was observed between MMSE score and both urine kynurenic acid (r = 0.1427, p = 0.0032 (Holm-adjusted p = 0.0307)) and serotonin (r = 0.1185, p = 0.0055 (Holm adjusted))
Fig. 6
Fig. 6
Metabolite comparison between mild cognitive impairment subgroups. Boxplots highlighting differences between metabolite concentrations in serum when comparing two subgroups of participants with a baseline clinical diagnosis of mild cognitive impairment (MCI). The first group (blue) remained cognitively stable throughout follow-up study visits (stable MCI (sMCI)), whilst the second group (yellow) experienced a deterioration in cognition and converted to a clinical diagnosis of AD at follow-up (converting MCI (cMCI)). Boxplots are only presented for the metabolites in the serotonin and kynurenine pathways that reported significant differences between control, MCI and AD participant groups in phases 1 and 2 of the study (Supplementary Figs. S1 and S2). No significant differences were observed between the sMCI and cMCI groups in this study
Fig. 7
Fig. 7
Metabolite associations across biofluids. Scatter plots fitted with a linear regression describing the correlation between significant serum and urine metabolites. Correlations were calculated where both biofluids from a single individual were available. Significant positive correlations were observed for serum tryptophan/urine tryptophan, serum kynurenine/urine kynurenic acid, serum xanthurenic acid/urine xanthurenic acid and serum serotonin/urine 5-indoleacetic acid; however, serum serotonin/urine serotonin did not demonstrate a significant correlation
Fig. 8
Fig. 8
Impact of selective serotonin reuptake inhibitor (SSRI) medication. Boxplots highlighting differences between study participants from the AD study group who had been prescribed SSRI medication and those who had not. There were no significant differences (analysis by Mann-Whitney U tests) when comparing the metabolites tryptophan and the downstream metabolite 5-hydroxyindoleaceitic acid in both urine and serum. There was also no significant difference in serotonin in urine; however, in serum, there were significantly lower levels of serotonin in the AD group who were prescribed SSRI medication for depression. Further longitudinal work would be required to determine if this is a result of the SSRI medication or due to the underlying pathophysiology of the individual that leads to treatment for depressive symptoms
Fig. 9
Fig. 9
Tryptophan pathway. Pathway map presenting the key metabolites that reported significant inter-group differences following Kruskal-Wallis tests. Post hoc Dunn tests revealed that those highlighted with red shading were significantly lower in the AD group in serum, whilst those highlighted with blue shading were significantly lower in AD in urine. The downstream metabolites are inherently more polar and are therefore fit with biological and metabolic logic that polar, downstream metabolites would be renally excreted and therefore altered in urine

References

    1. Heppner FL, Ransohoff RM, Becher B. Immune attack: the role of inflammation in Alzheimer disease. Nat Rev Neurosci. 2015;16(6):358–372. doi: 10.1038/nrn3880. - DOI - PubMed
    1. Carret-Rebillat A-S, et al. Neuroinflammation and Aβ accumulation linked to systemic inflammation are decreased by genetic PKR down-regulation. Sci Rep. 2015;5(1):8489. doi: 10.1038/srep08489. - DOI - PMC - PubMed
    1. Rodríguez JJ, Noristani HN, Verkhratsky A. The serotonergic system in ageing and Alzheimer’s disease. Prog Neurobiol. 2012;99(1):15–41. doi: 10.1016/j.pneurobio.2012.06.010. - DOI - PubMed
    1. Cirrito JR, et al. Serotonin signaling is associated with lower amyloid-β levels and plaques in transgenic mice and humans. Proc Natl Acad Sci. 2011;108(36):14968. doi: 10.1073/pnas.1107411108. - DOI - PMC - PubMed
    1. Pimenova AA, Thathiah A, De Strooper B, Tesseur I. Regulation of amyloid precursor protein processing by serotonin signaling. PLoS One. 2014;9(1):e87014. doi: 10.1371/journal.pone.0087014. - DOI - PMC - PubMed

Publication types