. 2021 Feb 22;56(4):427-442.e5.
doi: 10.1016/j.devcel.2020.12.010. Epub 2020 Dec 16.

ORF3a of the COVID-19 virus SARS-CoV-2 blocks HOPS complex-mediated assembly of the SNARE complex required for autolysosome formation

Affiliations

ORF3a of the COVID-19 virus SARS-CoV-2 blocks HOPS complex-mediated assembly of the SNARE complex required for autolysosome formation

Guangyan Miao et al. Dev Cell. .

Abstract

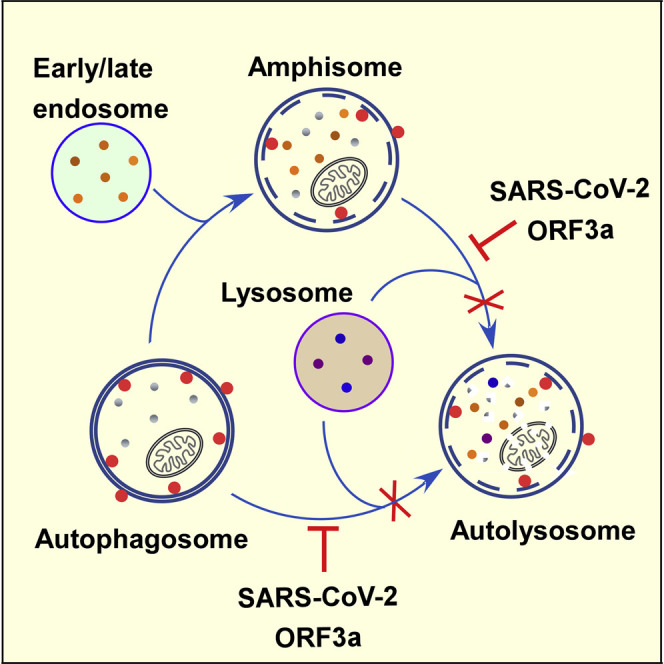
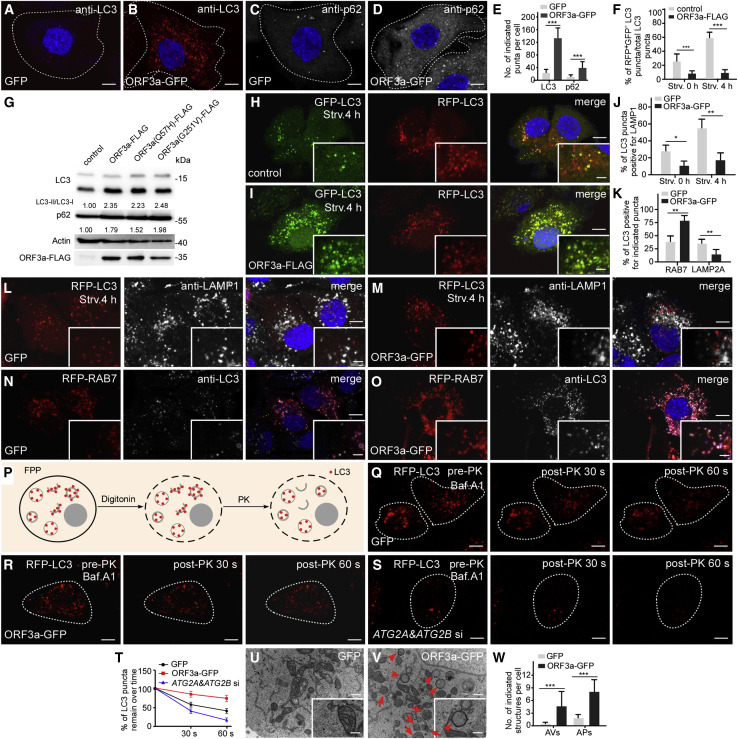
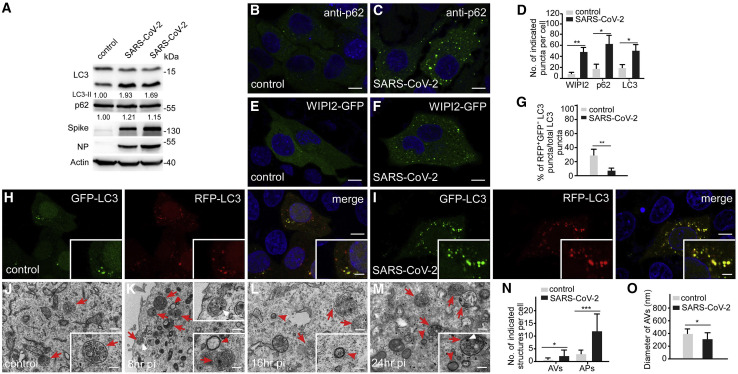
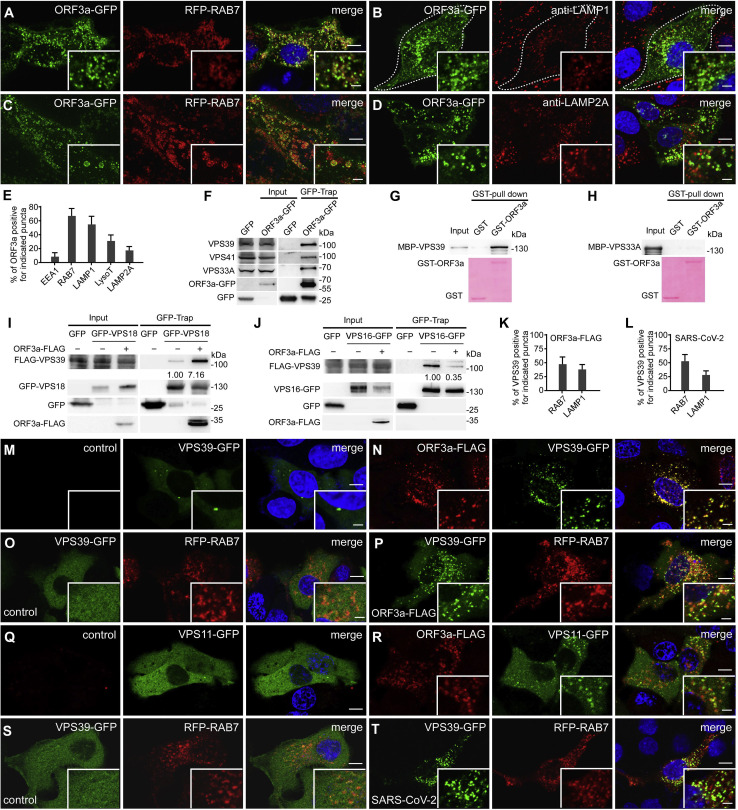
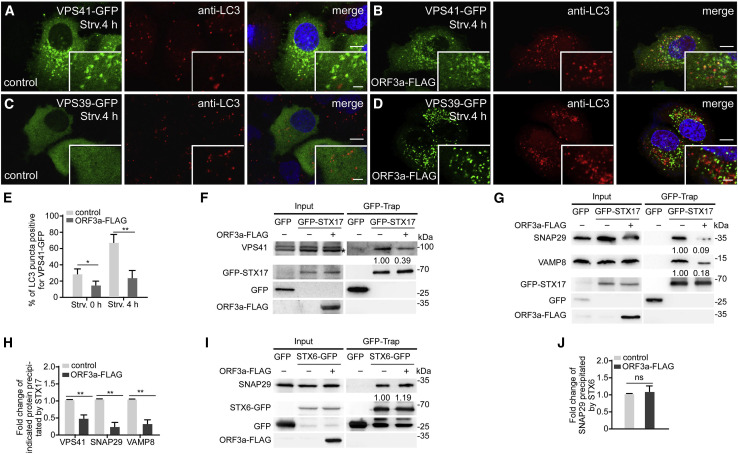
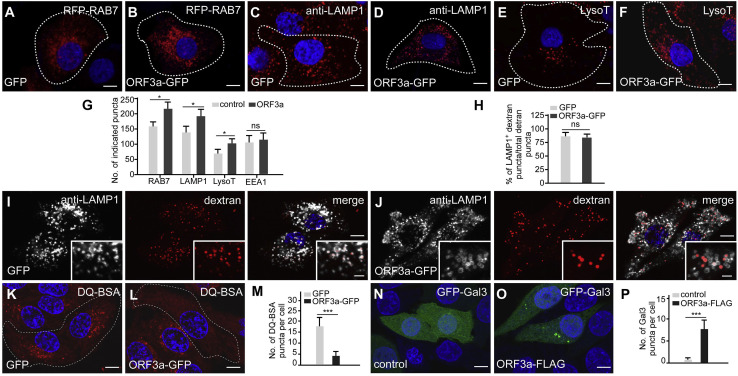
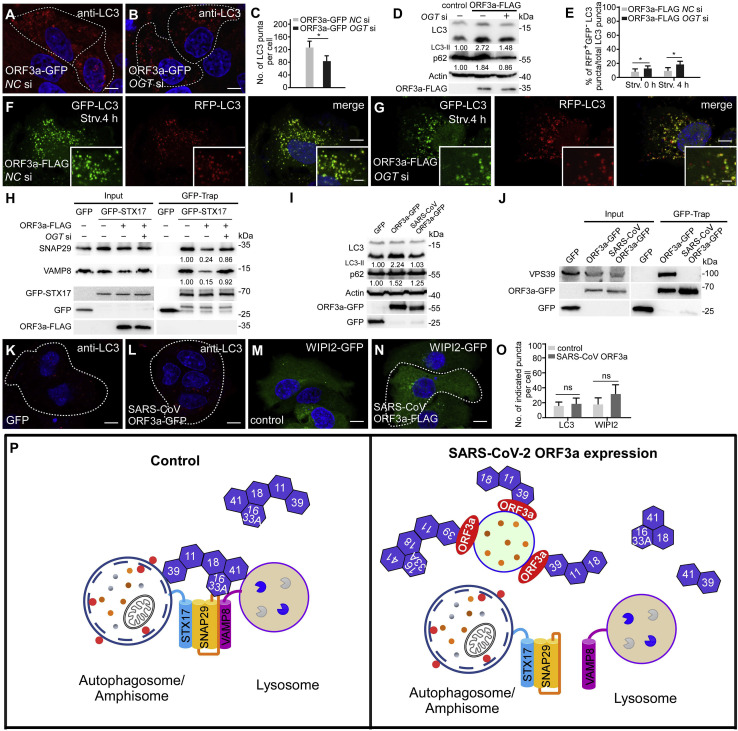
Autophagy acts as a cellular surveillance mechanism to combat invading pathogens. Viruses have evolved various strategies to block autophagy and even subvert it for their replication and release. Here, we demonstrated that ORF3a of the COVID-19 virus SARS-CoV-2 inhibits autophagy activity by blocking fusion of autophagosomes/amphisomes with lysosomes. The late endosome-localized ORF3a directly interacts with and sequestrates the homotypic fusion and protein sorting (HOPS) component VPS39, thereby preventing HOPS complex from interacting with the autophagosomal SNARE protein STX17. This blocks assembly of the STX17-SNAP29-VAMP8 SNARE complex, which mediates autophagosome/amphisome fusion with lysosomes. Expression of ORF3a also damages lysosomes and impairs their function. SARS-CoV-2 virus infection blocks autophagy, resulting in accumulation of autophagosomes/amphisomes, and causes late endosomal sequestration of VPS39. Surprisingly, ORF3a from the SARS virus SARS-CoV fails to interact with HOPS or block autophagy. Our study reveals a mechanism by which SARS-CoV-2 evades lysosomal destruction and provides insights for developing new strategies to treat COVID-19.

Keywords: COVID-19; DMV; HOPS; ORF3a; SARS-CoV-2; SNARE; autophagy.


Conflict of interest statement

Declaration of interests The authors declare no competing interests.

Figures

None
Graphical abstract
Figure 1
Figure 1
Expression of ORF3a blocks autophagosome maturation (A–E) Compared with control cells (A and C), HeLa cells expressing ORF3a-GFP contain more LC3 puncta and p62 puncta (B and D). Cells expressing GFP or ORF3a-GFP are outlined. (E) shows quantification of the number of LC3 puncta in (A and B) and p62 puncta in (C and D) (mean ± SEM., n = 25 cells in each group). ∗∗∗p < 0.001. Scale bars, 5 μm. (F) Shows the percentage of RFP+GFPLC3 puncta among total LC3 puncta in control and ORF3a-FLAG-expressing cells (mean ± SEM, n = 27 cells in each group). Strv, starvation. ∗∗∗p < 0.001. (G) Immunoblotting assays showing that levels of LC3 and p62 are increased in cells expressing ORF3a-FLAG and ORF3a(Q57H or G251V)-FLAG. Levels of LC3-II/LC3-I and p62 levels are normalized by actin and set to 1.00 in control cells. (H and I) Compared with control cells (H), cells expressing ORF3a-FLAG contain far fewer RFP+GFPLC3 puncta (I) after 4-h starvation. Scale bars, 5 μm; inserts, 2 μm. (J) Quantification of the percentage of LC3 puncta co-localizing with LAMP1-labeled lysosomes in control and ORF3a-GFP-expressing cells. Data are shown as mean ± SEM (n = 21 cells in each group). Puncta labeled by LAMP1 with strong fluorescence intensity were counted, while those with very faint fluorescence intensity were not counted. p < 0.05. ∗∗p < 0.01. (K) Quantification of the percentage of LC3 puncta co-localizing with the indicated puncta in control and ORF3a-GFP-expressing cells. Data are shown as mean ± SEM (n = 20 cells in each group). ∗∗p < 0.01. (L and M) Compared with control cells (L), LC3 puncta are largely separate from LAMP1-labeled lysosomes in ORF3a-GFP-expressing cells under nutrient-rich conditions and starvation conditions (M). Scale bars, 5 μm; inserts, 2 μm. (N and O) In ORF3a-GFP-expressing cells, a larger percentage of LC3 puncta co-localize with RAB7-labeled late endosomes (O) than in control cells (N). Scale bars: 5 μm; inserts, 2 μm. (P) Schematic illustration of the FPP assay. After 5 min treatment with 20 μM digitonin, the plasma membrane of the cell is permeabilized, while the membranes of intracellular organelles are intact. The RFP-LC3 signals inside closed autophagosomes or autolysosomes are protected from addition of PK, while RFP-LC3 localized on isolation membranes and the outer membrane of autophagosomes is digested by PK. RFP-LC3 is shown as red dots. PK, proteinase K. (Q and R) In FPP assays, time-lapse images show that after 6 h Bafilomycin A1 (Baf.A1) treatment, most of the RFP-LC3 puncta in permeabilized control and ORF3a-GFP-expressing cells are resistant to PK treatment. Scale bars, 5 μm. (S) In FPP assays, the RFP-LC3 signal disappears in Baf.A1-treated siATG2A/B cells upon PK treatment for 30 and 60 s. Scale bars: 5 μm. (T) Quantification of the percentage of LC3 puncta that remain over time in FPP assays in control cells, ORF3a-GFP-expressing cells and ATG2A & ATG2B KD cells. Data are shown as mean ± SEM (n = 15 cells in each group). (U–W) EM analysis indicates that autophagosomes (arrowheads) and amphisomes (arrows) accumulate in ORF3a-GFP-expressing cells (V) but are largely absent in control cells (U) under nutrient-rich conditions. Quantification of the number of autophagosomes and amphisomes per image in (W) is shown as mean ± SEM (n = 66 cells in each group, one image for each cell). ∗∗∗p < 0.001. Scale bars, 0.5 μm; inserts, 0.1 μm. See also Figures S1 and S2.
Figure 2
Figure 2
SARS-CoV-2 infection blocks autophagosome maturation (A) Immunoblotting assays showing that levels of LC3 and p62 are increased in SARS-CoV-2-infected cells. HeLa cells were transfected with human ACE2, then infected with SARS-CoV-2 virus and harvested at 16 hpi (hpi, hours post-inoculation). Lane 2 and lane 3 show cells infected with 4 × 105 TCID50 (tissue culture infectious dose 50%)/well and 2 × 106 TCID50/well, respectively. Levels of LC3-II and p62 are normalized by actin and set to 1.00 in control cells. (B–D) Compared with control cells (B), p62 forms more punctate structures in cells infected with SARS-CoV-2 virus (1 × 105 TCID50/well) (C). (D) shows quantification of the indicated puncta in control cells and SARS-CoV-2 virus-infected cells (1 × 105 TCID50/well). Data are shown as mean ± SEM (n = 18 cells in each group). p < 0.05; ∗∗p < 0.01. Scale bars, 5 μm. (E and F) Compared with control cells (E), WIPI2-GFP forms more punctate structures in cells infected with SARS-CoV-2 virus (1 × 105 TCID50/well) (F). Scale bars, 5 μm. (G–I) Compared with control cells (H), cells infected with SARS-CoV-2 virus contain many more RFP+GFP+LC3 puncta (I). (G) shows quantification of the percentage of RFP+GFPLC3 puncta among total LC3 puncta in control and SARS-CoV-2-infected cells (mean ± SEM, n = 20 cells in each group). ∗∗p < 0.01. Scale bars, 5 μm; inserts, 2 μm. (J–O) EM analysis indicates that many more autophagosomes (red arrowheads) and amphisomes (red arrows) accumulate in SARS-CoV-2 virus-infected cells at 8 hpi (K), 16 hpi (L), and 24 hpi (M) than control cells (J). The white arrowheads indicate virion particles. Quantification of the number of autophagosomes and amphisomes in (N) is shown as mean ± SEM (n = 89 cells in each group, one image for each cell). (O) shows quantification of the diameter of autophagosomes as mean ± SEM (n = 32 autophagosomes in each group). The diameter is about 251 ± 157 nm in SARS-CoV-2 virus-infected cells. p < 0.05, ∗∗∗p < 0.001. Scale bars: 0.5 μm; inserts, 0.1 μm. See also Figure S2.
Figure 3
Figure 3
ORF3a localizes to late endosomes/lysosomes and interacts with components of the HOPS complex (A) ORF3a-GFP forms a large number of punctate structures that are largely colocalized with late endosomes labeled by RFP-RAB7 in HeLa cells. Weak ORF3a-GFP signal is localized on the plasma membrane. Scale bars, 5 μm; inserts, 2 μm. (B) ORF3a-GFP puncta partially co-localize with LAMP1-labeled late endosomes/lysosomes, detected by anti-LAMP1. Scale bars, 5 μm; inserts, 2 μm. (C) 3D-SIM images showing that ORF3a-GFP colocalizes with RFP-RAB7 on vesicles. Images are maximum intensity projections of z stacks (z = 35). Scale bars, 5 μm; inserts, 1 μm. (D) ORF3a-GFP puncta are separate from LAMP2A-labeled lysosomes, detected by anti-LAMP2A. Scale bars, 5 μm; inserts, 2 μm. (E) Quantification of the percentage of ORF3a-GFP puncta co-localizing with vesicles labeled by the indicated marker. (F) Endogenous VPS39, VPS41, and VPS33A are co-precipitated by ORF3a-GFP in GFP-TRAP assays. Extracts of cells expressing GFP vector and ORF3a-GFP were precipitated by GFP-TRAP beads and immunoblotted with anti-VPS39, anti-VPS41, and anti-VPS33A. ~5% of extracts used for GFP-TRAP assays are shown as the input. (G and H) Human full-length VPS39 (G), but not VPS33A (H), is pulled down by GST-ORF3a in an in vitro GST-pull-down assay. Proteins used for pull-down are shown in the bottom panel. (I) Levels of FLAG-tagged VPS39 precipitated by GFP-VPS18 are higher in ORF3a-FLAG-expressing cells than control cells in GFP-TRAP assays. Quantification of FLAG-VPS39 level (normalized by GFP-VPS18 level) is also shown. (J) In GFP-TRAP assays, levels of VPS39 precipitated by VPS16-GFP are lower in ORF3a-FLAG-expressing cells than control cells. Quantification of FLAG-VPS39 level (normalized by VPS16-GFP level) is also shown. (K) Quantification of the percentage of VPS39-GFP puncta co-localizing with vesicles labeled by the indicated marker in ORF3a-FLAG-expressing cells. (L) Quantification of the percentage of VPS39-GFP puncta co-localizing with vesicles labeled by the indicated marker in SARS-CoV-2 virus-infected cells. (M and N) In control cells (M), VPS39-GFP mainly localizes to the cytoplasm and forms very few punctate structures, while in cells expressing ORF3a-FLAG (N), VPS39-GFP forms a larger number of puncta that co-localize with ORF3a-FLAG. There are also some VPS39-GFP puncta showing very weak or no detectable ORF3a signal. Scale bars: 5 μm; inserts, 2 μm. (O and P) VPS39-GFP is largely diffuse in control cells (O). VPS39-GFP forms punctate structures that partially co-localize or closely associate with RAB7-labeled late endosomes in cells expressing ORF3a-FLAG (P). Scale bars, 5 μm; inserts, 2 μm. (Q and R) VPS11-GFP is largely diffuse in control cells (Q), while in ORF3a-expressing cells, VPS11-GFP forms some punctate structures that co-localize with ORF3a-FLAG (R). Scale bars: 5 μm; inserts, 2 μm. (S and T) In SARS-CoV-2 virus-infected cells, VPS39-GFP forms a large number of punctate structures that partially co-localize or closely associate with RAB7-labeled late endosomes (T). VPS39-GFP is diffuse in control cells (S). Scale bars, 5 μm; inserts, 2 μm. See also Figures S3 and S4.
Figure 4
Figure 4
ORF3a inhibits the formation of the STX17-SNAP29-VAMP8 complex (A and B) Compared with control cells (A), a smaller percentage of VPS41-GFP-labeled punctate structures co-localize with LC3 puncta in ORF3a-FLAG-expressing cells (B) after 4-h starvation. Scale bars: 5 μm; inserts, 2 μm. (C and D) LC3-labeled puncta are separate from VPS39-GFP-labeled punctate structures in ORF3a-FLAG-expressing cells (D) after 4-h starvation. VPS39-GFP is diffuse in control cells (C). Scale bars: 5 μm; inserts, 2 μm. (E) Quantification of the percentage of LC3-labeled puncta co-localizing with VPS41-GFP-labeled punctate structures is shown as mean ± SEM (n = 20 cells in each group). p < 0.05. ∗∗p < 0.01. (F) In GFP-TRAP assays, levels of endogenous VPS41 precipitated by GFP-STX17 are lower in ORF3a-FLAG-expressing cells than control cells. “” indicates the band corresponding to VPS41. Quantification of VPS41 level (normalized by GFP-STX17 level) is also shown. (G) In GFP-TRAP assays, levels of endogenous SNAP29 and VAMP8 precipitated by GFP-STX17 are much lower in ORF3a-FLAG-expressing cells than control cells. Quantification of SNAP29 and VAMP8 levels (normalized by GFP-STX17 level) is also shown. (H) Quantification of the fold change of the indicated proteins in control cells and ORF3a-expressing cells is shown as mean ± SEM Results are representative of at least three experiments. ∗∗p < 0.01. (I) In GFP-TRAP assays, levels of endogenous SNAP29 precipitated by STX6-GFP show no obvious change in ORF3a-FLAG-expressing cells compared with control cells. Quantification of SNAP29 level (normalized by GFP-STX6 level) is also shown. (J) Quantification of the fold change of SNAP29 precipitated by STX6 in control cells and ORF3a-expressing cells is shown as mean ± SEM Results are representative of at least three experiments. ns: no significant difference. See also Figure S5.
Figure 5
Figure 5
ORF3a impairs lysosomal function (A–G) More punctate structures labeled by RFP-RAB7 (B), anti-LAMP1 antibody (D), and LysoTracker (F) are detected in ORF3a-GFP-expressing cells than in control cells (A, C, and E). Cells expressing indicated protein are marked by white dotted lines. Quantification of the number of the indicated punctate structures in GFP control and ORF3a-GFP-expressing cells is shown in (G) as mean ± SEM (n =18 cells in each group). LysoT: LysoTracker. ns: no significant difference; p < 0.05. Scale bars: 5 μm. (H–J) Similar to control cells (I), endocytosed dextran is largely colocalized with LAMP1-labeled punctate structures in ORF3a-GFP-expressing cells (J). Quantification of the percentage of LAMP1+ dextran puncta among total dextran puncta is shown in (H) as mean ± SEM (n = 20 cells in each group). ns: no significant difference. Scale bars, 5 μm; inserts, 2 μm. (K–M) Compared with control cells (K), far fewer DQ-BSA-labeled puncta are detected in ORF3a-GFP-expressing cells (L). Cells expressing GFP or ORF3a-GFP are outlined. Quantification of the number of DQ-BSA-labeled punctate structures in GFP control and ORF3a-GFP-expressing cells is shown in (M) as mean ± SEM (n = 25 cells in each group). ∗∗∗p < 0.001. Scale bars, 5 μm. (N–P) Galectin 3 is diffusely localized in control cells (N) but forms a few punctate structures in ORF3a-FLAG-expressing cells (O). Quantification data of the number of galectin-3-labeled puncta in (P) are shown as mean ± SEM (n = 25 cells in each group). ∗∗∗p < 0.001. Scale bars, 5 μm. See also Figure S6.
Figure 6
Figure 6
Enhanced autophagosome-lysosome fusion by depletion of OGT partially rescues the autophagy defect in ORF3a-expressing cells (A–C) Immunostaining with anti-LC3 antibody shows that the accumulation of LC3 puncta in ORF3a-GFP-expressing cells (A) is suppressed by simultaneous depletion of OGT (B). Cells expressing GFP and ORF3a-GFP are outlined. NC, negative control. Numbers of LC3 puncta are quantified and shown as mean ± SEM in (C) (n = 25 cells in each group). NC, negative control. p < 0.05. Scale bars, 5 μm. (D) Immunoblots of LC3 and p62 show that the increased levels of LC3-II and p62 are inhibited by siOGT in ORF3a-expressing cells. Levels of LC3-II and p62 (normalized by actin levels) are quantified. (E–G) RFP-GFP-LC3 assays show that the percentage of RFP+GFPLC3 puncta after 4-h starvation is increased in siOGT-treated ORF3a-expressing cells (G) compared with control siRNA-treated ORF3a-expressing cells (F). Quantification data (n = 27 cells in each group) are shown as mean ± SEM in (E). p < 0.05. Scale bars, 5 μm; inserts, 2 μm. (H) In GFP-TRAP assays, levels of endogenous SNAP29 and VAMP8 precipitated by GFP-STX17 are increased in siOGT-treated ORF3a-expressing cells compared with control siRNA-treated ORF3a-expressing cells. Quantification of SNAP29 and VAMP8 levels (normalized by GFP-STX17 levels) is shown. (I) Immunoblotting assays showing that levels of p62 are slightly increased, while levels of LC3-II show no obvious change, in SARS-CoV ORF3a-FLAG-expressing cells compared with control cells. Levels of LC3-II and p62 levels are normalized by actin. (J) In GFP-TRAP assays, endogenous VPS39 was precipitated by SARS-CoV-2 ORF3a-GFP, but not by SARS-CoV ORF3a-GFP. (K and L) Compared with control cells (K), expression of SARS-CoV ORF3a-GFP does not evidently increase the number of LC3 puncta (L). Scale bars: 5 μm. (M and N) Numbers of WIPI2-GFP punctate structures are similar in control cells (M) and SARS-CoV ORF3a-FLAG-expressing cells (N) under nutrient-rich conditions. Scale bars: 5 μm. (O) Quantification of the numbers of indicated puncta is shown as mean ± SEM (n = 20 cells in each group) ns: no significant difference. (P) A model showing how ORF3a of SARS-CoV-2 disrupts the HOPS-mediated assembly of the SNARE complex to impair autophagosome maturation. In control cells, the HOPS complex is recruited to autophagosomes by interacting with STX17, which further facilitates the assembly of the STX17-SNAP29-VAMP8 complex for fusion of autophagosomes/amphisomes with late endosomes/lysosomes. In SARS-CoV-2 ORF3a-expressing cells, the HOPS components (such as VPS39, VPS11, and VPS18) are sequestrated on late endosomes/lysosomes by ORF3a, thus, preventing the interaction of HOPS with autophagosomal STX17. 11, VPS11; 16, VPS16; 18, VPA18; 33A, VPS33A; 39, VPS39; 41, VPS41. In control cells, activated RAB7 may be involved in the interaction of HOPS with late endosomes/lysosomes. See also Figure S7.

Comment in

Similar articles

Cited by

References

    1. Aits S., Kricker J., Liu B., Ellegaard A.M., Hämälistö S., Tvingsholm S., Corcelle-Termeau E., Høgh S., Farkas T., Holm Jonassen A., et al. Sensitive detection of lysosomal membrane permeabilization by lysosomal galectin puncta assay. Autophagy. 2015;11:1408–1424. - PMC - PubMed
    1. Axe E.L., Walker S.A., Manifava M., Chandra P., Roderick H.L., Habermann A., Griffiths G., Ktistakis N.T. Autophagosome formation from membrane compartments enriched in phosphatidylinositol 3-phosphate and dynamically connected to the endoplasmic reticulum. J. Cell Biol. 2008;182:685–701. - PMC - PubMed
    1. Balderhaar H.J., Ungermann C. CORVET and HOPS tethering complexes - coordinators of endosome and lysosome fusion. J. Cell Sci. 2013;126:1307–1316. - PubMed
    1. Bird S.W., Maynard N.D., Covert M.W., Kirkegaard K. Nonlytic viral spread enhanced by autophagy components. Proc. Natl. Acad. Sci. USA. 2014;111:13081–13086. - PMC - PubMed
    1. Bonifacino J.S., Rojas R. Retrograde transport from endosomes to the trans-Golgi network. Nat. Rev. Mol. Cell Biol. 2006;7:568–579. - PubMed

Publication types