. 2021 Mar;29(3):346-356.
doi: 10.1016/j.joca.2020.12.017. Epub 2021 Jan 7.

A neural network to predict the knee adduction moment in patients with osteoarthritis using anatomical landmarks obtainable from 2D video analysis

Affiliations

A neural network to predict the knee adduction moment in patients with osteoarthritis using anatomical landmarks obtainable from 2D video analysis

M A Boswell et al. Osteoarthritis Cartilage. 2021 Mar.

Abstract

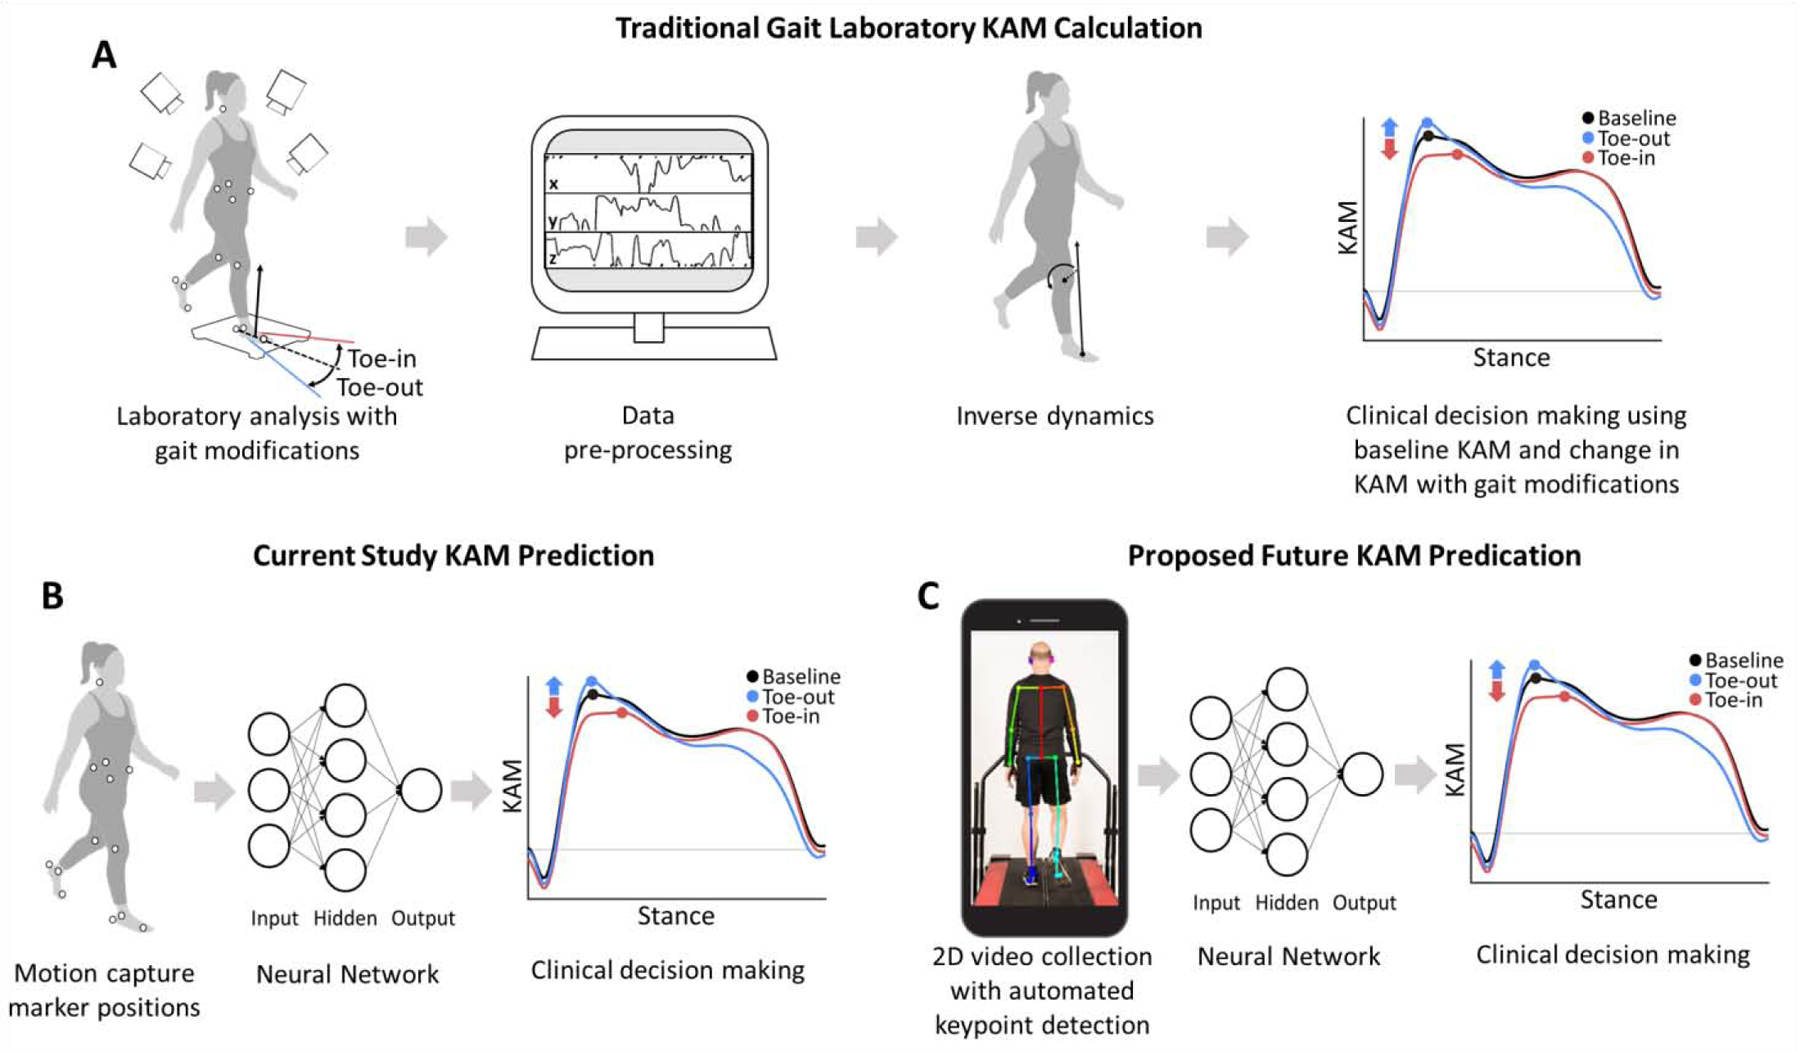
Objective: The knee adduction moment (KAM) can inform treatment of medial knee osteoarthritis; however, measuring the KAM requires an expensive gait analysis laboratory. We evaluated the feasibility of predicting the peak KAM during natural and modified walking patterns using the positions of anatomical landmarks that could be identified from video analysis.

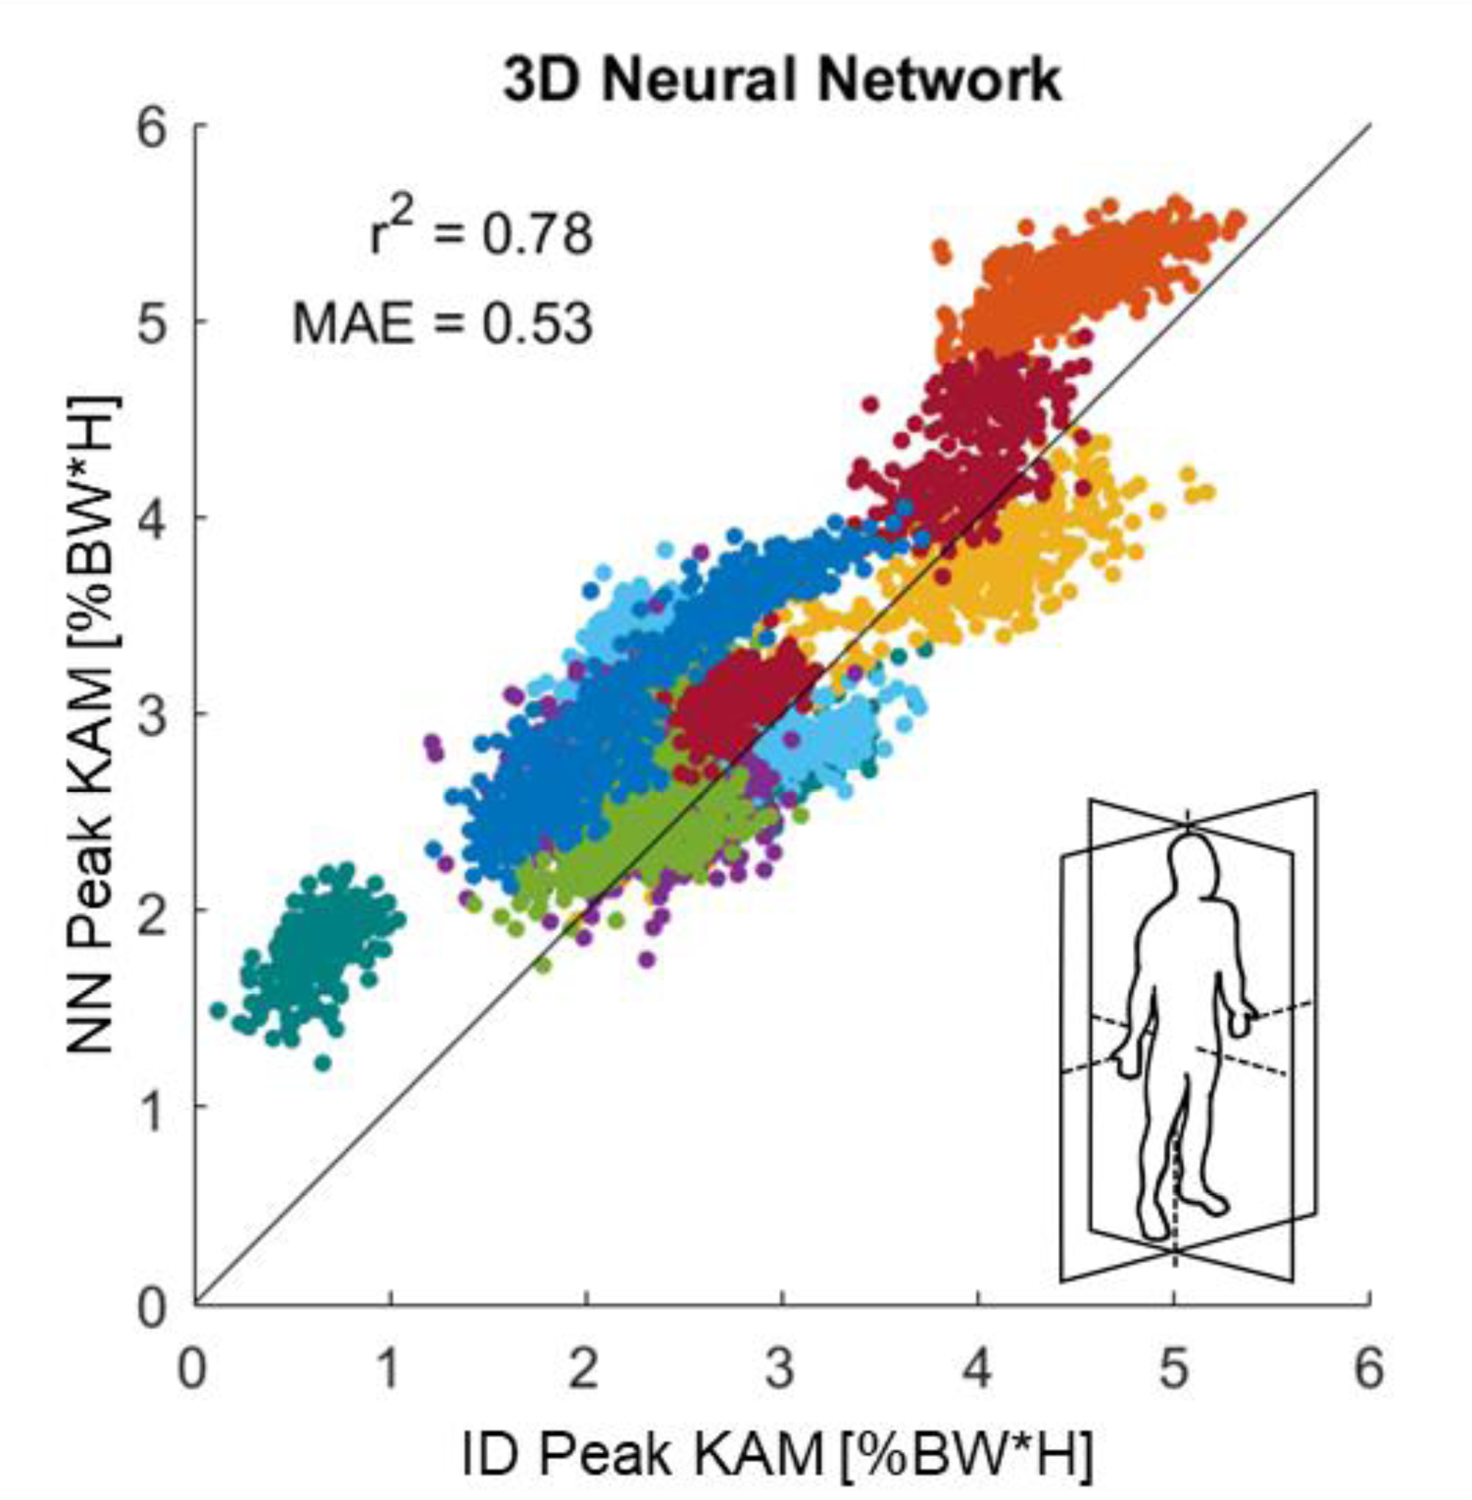
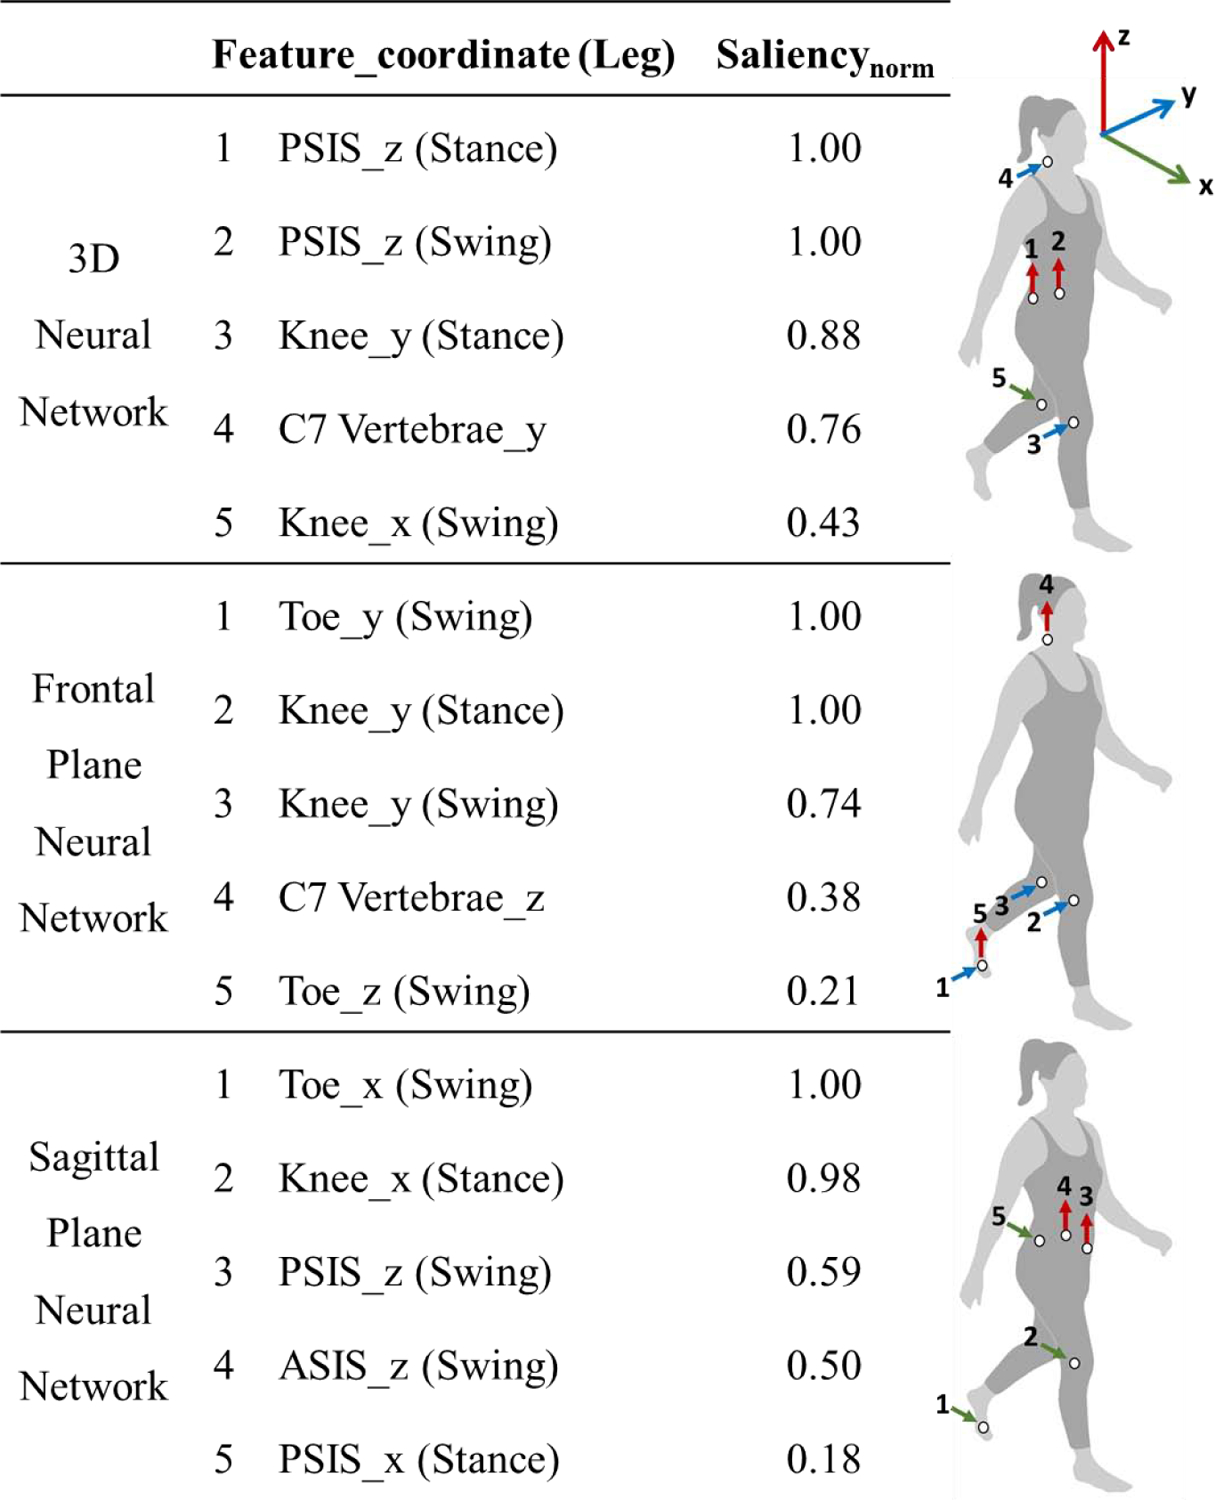
Method: Using inverse dynamics, we calculated the KAM for 86 individuals (64 with knee osteoarthritis, 22 without) walking naturally and with foot progression angle modifications. We trained a neural network to predict the peak KAM using the 3-dimensional positions of 13 anatomical landmarks measured with motion capture (3D neural network). We also trained models to predict the peak KAM using 2-dimensional subsets of the dataset to simulate 2-dimensional video analysis (frontal and sagittal plane neural networks). Model performance was evaluated on a held-out, 8-person test set that included steps from all trials.

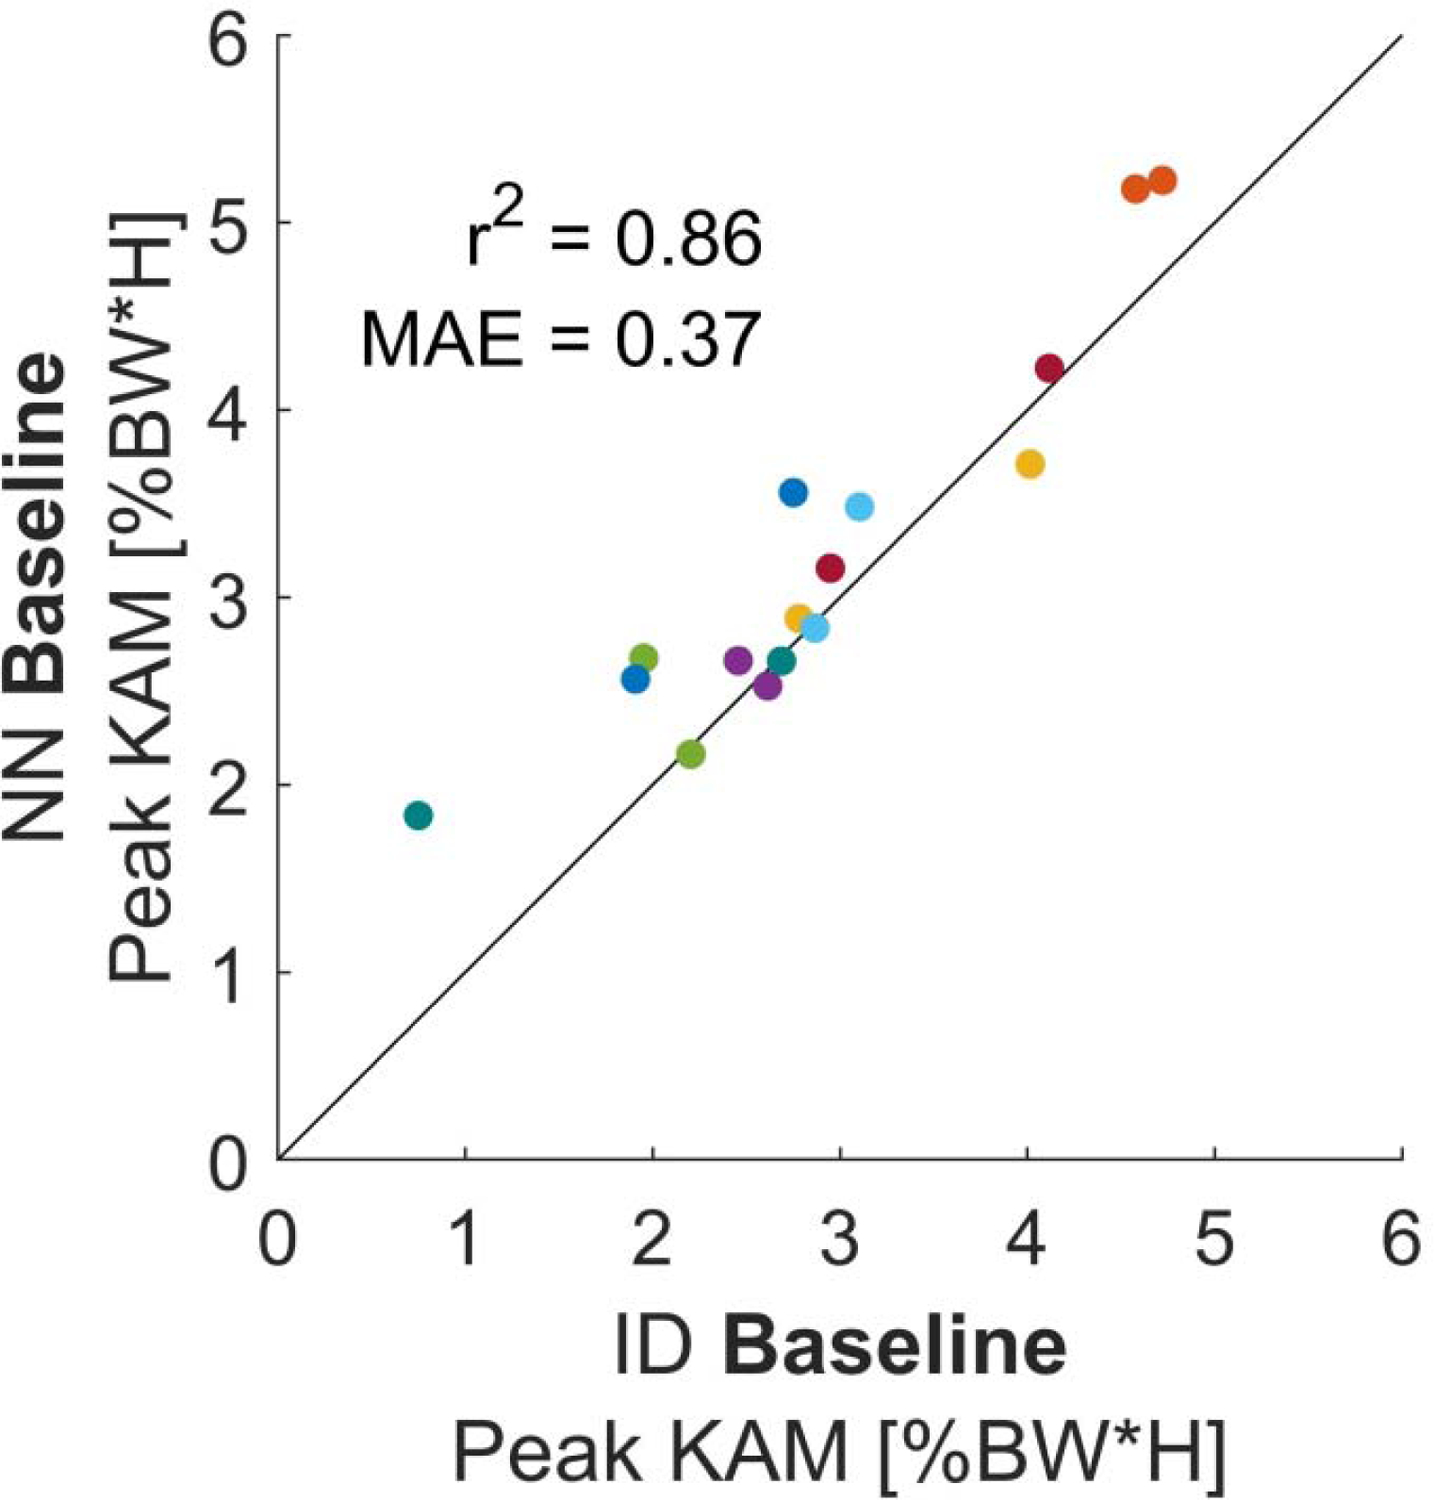
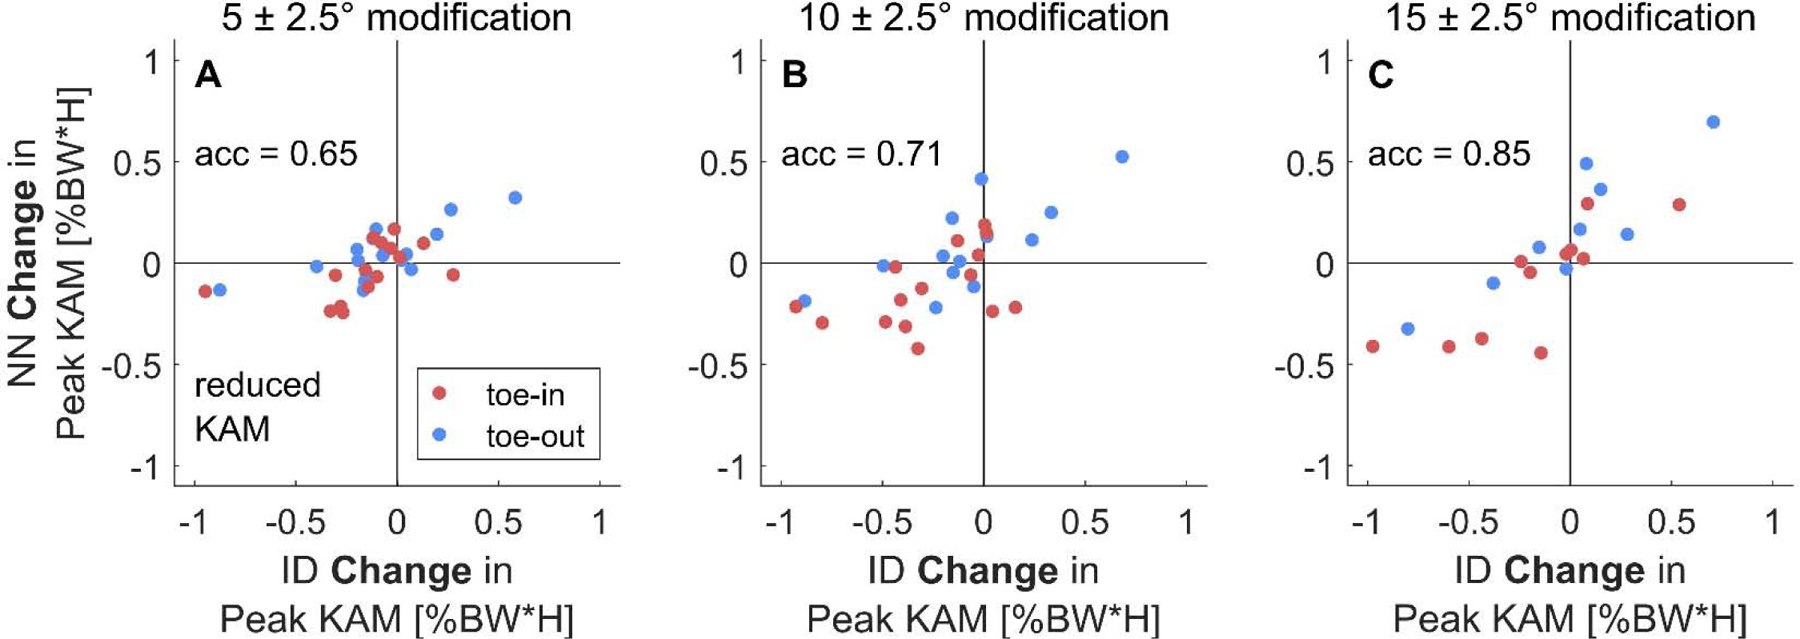
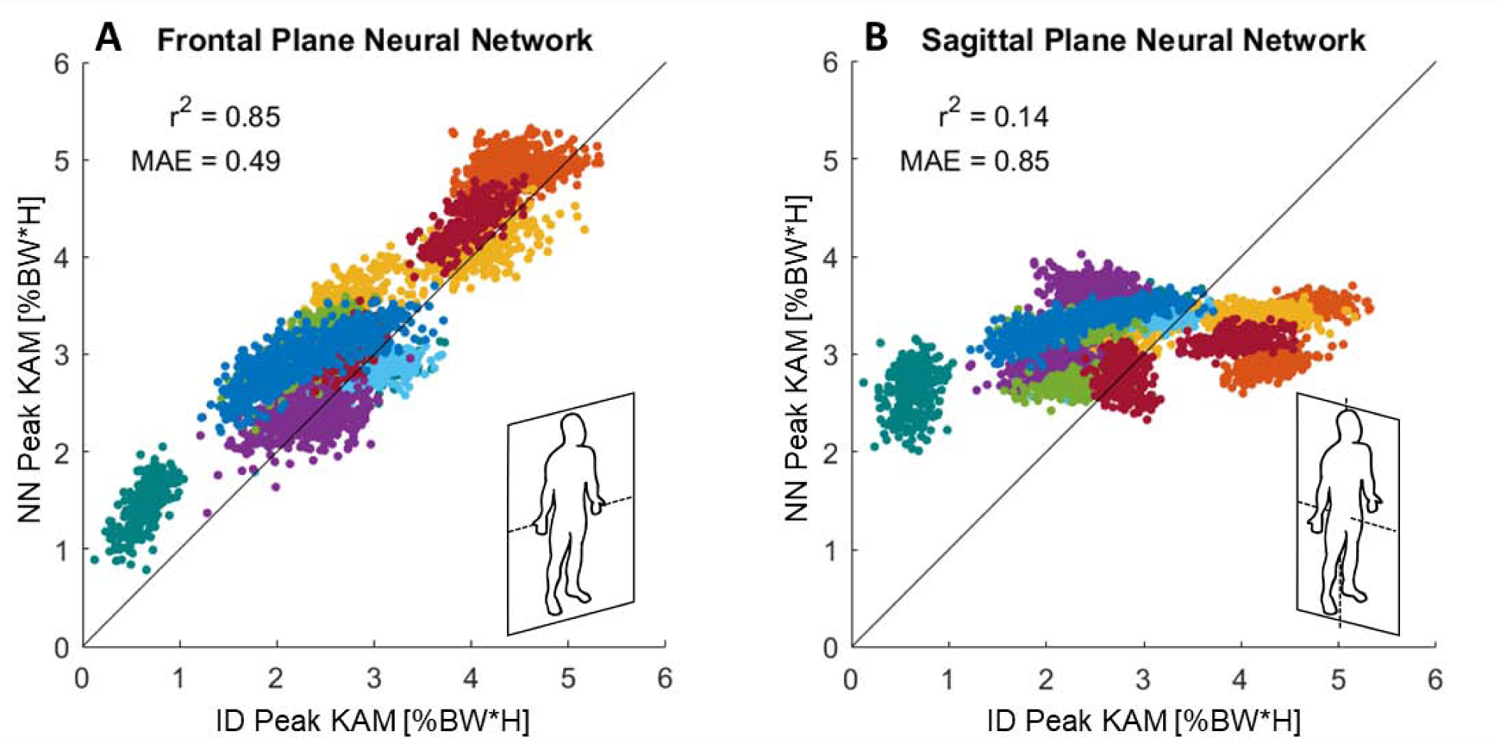
Results: The 3D neural network predicted the peak KAM for all test steps with r2( Murray et al., 2012) 2 = 0.78. This model predicted individuals' average peak KAM during natural walking with r2( Murray et al., 2012) 2 = 0.86 and classified which 15° foot progression angle modifications reduced the peak KAM with accuracy = 0.85. The frontal plane neural network predicted peak KAM with similar accuracy (r2( Murray et al., 2012) 2 = 0.85) to the 3D neural network, but the sagittal plane neural network did not (r2( Murray et al., 2012) 2 = 0.14).

Conclusion: Using the positions of anatomical landmarks from motion capture, a neural network accurately predicted the peak KAM during natural and modified walking. This study demonstrates the feasibility of measuring the peak KAM using positions obtainable from 2D video analysis.

Keywords: Gait; Knee adduction moment; Machine learning; Neural network; Osteoarthritis; Video motion analysis.


Conflict of interest statement

Competing Interests

The authors have no conflicts of interest to declare.

Figures

Figure 1.
Figure 1.
A) The gold standard, laboratory-based workflow for measuring the knee adduction moment (KAM). After motion capture data is collected and semi-manually pre-processed, it is combined with force plate data to compute the KAM using inverse dynamics. B) The workflow for the current study. We use the coordinates of 13 anatomical landmarks from motion capture (to simulate video keypoints) as inputs into a neural network trained to predict the peak KAM. C) Our proposed future workflow for the automated measurement of the KAM. After collecting 2D video of gait, keypoints (e.g., joint positions) could be detected automatically using OpenPose. A neural network would predict the peak KAM using these keypoints as input.
Figure 2.
Figure 2.
The predicted peak knee adduction moment (KAM) from the neural network (NN) using 3D anatomical landmark positions as input (3D neural network) vs. the peak KAM calculated from inverse dynamics (ID) plotted against the y=x line. Presented data are for test subjects from the baseline and foot progression angle modification trials. Each point represents a single step, and a single color represents the steps from both legs of a subject.
Figure 3.
Figure 3.
The top five most salient features (features that, when changed, have the greatest effect on the predicted peak KAM) normalized by the most salient feature for the 3D, frontal plane, and sagittal plane neural networks (left). The positions and Cartesian coordinate directions of the most salient features (right) where x corresponds to the anterior-posterior direction, y to medio-lateral, and z to superior-inferior.
Figure 4.
Figure 4.
The peak knee adduction moment (KAM) estimated by the 3D neural network (NN) and inverse dynamics (ID) from the baseline (natural walking) trial. Data are averaged over all baseline steps for each leg of each subject (represented by a color) in the test set plotted against the y=x line.
Figure 5.
Figure 5.
The average change in the peak knee adduction moment (KAM) estimated by the 3D neural network (NN) vs. inverse dynamics (ID) for 5°, 10°, and 15° foot progression angle modifications for each leg of each subject in the test set. The accuracy (acc.) of classification is increases with increasing degrees of foot progression angle modification.
Figure 6.
Figure 6.
The performance of neural networks that use planar projections of anatomical landmark positions as inputs. A) The frontal plane neural network predicts the peak KAM with similar accuracy to the 3D neural network (r2=0.85). B) The sagittal plane neural network is less accurate (r2=0.14) than the 3D or frontal plane neural networks. Presented data are for test subjects from the baseline and foot progression angle modification trials. A point represents a single step, and a single color represents the steps from both legs of a subject.

References

    1. Deshpande BR, Katz JN, Solomon DH, Yelin EH, Hunter DJ, Messier SP, et al. The number of persons with symptomatic knee osteoarthritis in the United States: Impact of race/ethnicity, age, sex, and obesity. Arthritis Care Res. 2016;68(12):1743–1750. doi: 10.1002/acr.22897 - DOI - PMC - PubMed
    1. Murray CJL, Vos T, Lozano R, Naghavi M, Flaxman AD, Michaud C, et al. Disability-adjusted life years (DALYs) for 291 diseases and injuries in 21 regions, 1990–2010: A systematic analysis for the Global Burden of Disease Study 2010. Lancet. 2012;380(9859):2197–2223. doi: 10.1016/S0140-6736(12)61689-4 - DOI - PubMed
    1. Wise BL, Niu J, Yang M, Lane NE, Harvey W, Felson DT, et al. Patterns of compartment involvement in tibiofemoral osteoarthritis in men and women and in whites and African Americans. Arthritis Care Res. 2012;64(6):847–852. doi: 10.1002/acr.21606 - DOI - PMC - PubMed
    1. Mündermann A, Dyrby CO, D’Lima DD, Colwell CW, Andriacchi TP. In vivo knee loading characteristics during activities of daily living as measured by an instrumented total knee replacement. J Orthop Res. 2008;26(9):1167–1172. doi: 10.1002/jor.20655 - DOI - PubMed
    1. Kutzner I, Trepczynski A, Heller MO, Bergmann G. Knee adduction moment and medial contact force-facts about their correlation during gait. PLoS One. 2013;8(12):8–15. doi: 10.1371/journal.pone.0081036 - DOI - PMC - PubMed

Publication types

LinkOut - more resources