. 2021 Apr;230(2):612-628.
doi: 10.1111/nph.17179. Epub 2021 Feb 14.

Growth-regulating factor 5 (GRF5)-mediated gene regulatory network promotes leaf growth and expansion in poplar

Affiliations

Growth-regulating factor 5 (GRF5)-mediated gene regulatory network promotes leaf growth and expansion in poplar

Wenqi Wu et al. New Phytol. 2021 Apr.

Abstract

Although polyploid plants have larger leaves than their diploid counterparts, the molecular mechanisms underlying this difference (or trait) remain elusive. Differentially expressed genes (DEGs) between triploid and full-sib diploid poplar trees were identified from two transcriptomic data sets followed by a gene association study among DEGs to identify key leaf growth regulators. Yeast one-hybrid system, electrophoretic mobility shift assay, and dual-luciferase assay were employed to substantiate that PpnGRF5-1 directly regulated PpnCKX1. The interactions between PpnGRF5-1 and growth-regulating factor (GRF)-interacting factors (GIFs) were experimentally validated and a multilayered hierarchical regulatory network (ML-hGRN)-mediated by PpnGRF5-1 was constructed with top-down graphic Gaussian model (GGM) algorithm by combining RNA-sequencing data from its overexpression lines and DAP-sequencing data. PpnGRF5-1 is a negative regulator of PpnCKX1. Overexpression of PpnGRF5-1 in diploid transgenic lines resulted in larger leaves resembling those of triploids, and significantly increased zeatin and isopentenyladenine in the apical buds and third leaves. PpnGRF5-1 also interacted with GIFs to increase its regulatory diversity and capacity. An ML-hGRN-mediated by PpnGRF5-1 was obtained and could largely elucidate larger leaves. PpnGRF5-1 and the ML-hGRN-mediated by PpnGRF5-1 were underlying the leaf growth and development.

Keywords: Populus; cytokinin; gene regulatory network; growth-regulating factor; leaf growth; leaf size; triploid.


Figures

Fig. 1
Fig. 1
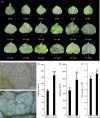
Phenotypic analysis of triploid and full‐sib diploid poplars. (a). The fifth leaves were harvested from randomly selected six genotypes of triploid populations and their full‐sib diploid population. Bar, 2 cm. Di, diploid; Tri, triploid; F, first division restitution (FDR) gametes; S, second division restitution (SDR) gametes; g1, genotype 1. (b, c) Paradermal view of palisade cells in the fifth leaves from 3‐month‐old diploid and triploid poplars (eight leaves were examined). Bars, 10 μm. (d–f) Leaf area, cell area, and calculated cell numbers of fifth leaves from 3‐month‐old diploid and triploid poplars (30 leaves were measured). *, P < 0.05; **, P < 0.01 (determined by Student’s t‐test). Values represent the mean ± SD (n = 30).
Fig. 2
Fig. 2
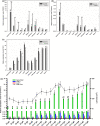
Expression analyses of PpnGRF5 and PpnCKX1 in triploid poplars. (a, b, c) Tissue‐specific expression patterns of PpnGRF5‐1, PpnGRF5‐2, and CKX1 genes relative to ACTIN in vegetative tissues of 3‐month‐old triploid and diploid poplar plants. *, P < 0.05; **, P < 0.01 (determined by Student’s t‐test). (d) Bar chart: expression level of PpnGRF5‐1 in apical buds, the third leaves, and the fifth leaves in six different genotypes of 4‐month‐old triploid and full‐sib diploid poplars. Different letters denote statistically significant differences resulting from Tukey’s range test following two‐way ANOVA. Values represent the mean ± SD (n = 3). Line plot: leaf area of the fifth leaves of the different genotypes of diploid and triploid poplars. Values represent the mean ± SD (n = 10). Di, diploid; Tri, triploid; F, first division restitution (FDR) gametes; S, second division restitution (SDR) gametes; g1, genotype 1.
Fig. 3
Fig. 3
PpnGRF5‐1 interacts with PpnGIFs. (a) Yeast cells of co‐transformants of PpnGRF5‐1 and GIFs grown on SD/‐Trp‐Leu and SD/‐Trp‐Leu‐His‐Ade medium at 30°C for 3 d. PpnGRF5‐1 was fused to transcription activation domain (AD), and GIFs were fused to DNA‐binding domain (BD). pAD and pBD are negative controls. (b) Split‐luciferase (LUC) complementation assay reveals the interaction between PpnGRF5‐1 and GIFs. PpnGRF5‐1 was fused to the N‐terminal portions of LUC (nLUC), and GIFs were fused to the C‐terminal portion of LUC (cLUC). Agrobacteria carrying different plasmids as indicated were co‐expressed in Nicotiana benthamiana. Representative images of N. benthamiana leaves 48 h after infiltration are shown. Color scale represents LUC activity. The experiment was repeated three times with similar results. (c) In vitro pull‐down assays assessing physical interactions between PpnGRF5‐1 and GIFs. GST‐PpnGRF5‐1 was incubated in binding buffer containing glutathione‐agarose beads with or without PpnGIFs‐6 × His, and agarose beads were washed five times and eluted. Lysis of Escherichia coli (Input) and eluted proteins (Pull down) from beads was immublotted using anti‐HIS and anti‐GST antibodies.
Fig. 4
Fig. 4
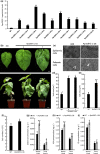
Phenotypic and cytokinin content analysis of PpnGRF5‐1 overexpression transgenic 84K lines. (a) Expression levels of PpnGRF5‐1 in the apical buds (including unexpended leaflets) of PpnGRF5‐1 overexpression (OE) lines. Values represent the mean ± SD (n = 5). (b) The fifth leaves (upper panel) of 3‐month‐old PpnGRF5‐1 overexpression and 84K wild‐type (WT) poplar trees and whole trees (lower panel) by tissue culture grown in soil in pots. Bars: 1 cm in leaves, 2 cm in trees. (c) Paradermal view of epidemic and palisade cells in the fifth leaves from the apical buds of 3‐month‐old PpnGRF5‐1OE poplar trees by tissue culture. Bars, 10 μm. (d–f) Leaf area, cell area, and calculated cell numbers of fifth leaves from 3‐month‐old PpnGRF5‐1 overexpression and WT 84K poplar trees by tissue culture. Different letters denote statistically significant differences resulting from Tukey’s range test following one‐way ANOVA. *, P < 0.05; **, P < 0.01 (determined by Student’s t‐test). Values represent the mean ± SD. (g–i) Cytokinin content, including zeatin (g), isopentenyladenine (IPA) (h), and trans‐zeatin (tZ) (i), detected in the apical buds and third leaves in 3‐month‐old PpnGRF5‐1 overexpression and 84K WT poplar trees from tissue couture. PpnGRF5‐1OE means the mixed leaf samples of PpnGRF5‐1‐OE transgenic lines 5 and 7. *, P < 0.05; **, P < 0.01 (determined by Student’s t‐test). Values represent the mean ± SD (n = 5).
Fig. 5
Fig. 5
PpnGRF5‐1 binds directly to the PagCKX1 promoter. (a) The putative PpnGRF binding elements in the PagCKX1 promoter (upper panel) and mutagenesis of the PpnGRF binding element in the PagCKX1 promoters (lower panel). The mutant GCTACT was obtained after screening against possible binding variants of PpnGRF5‐1 yielded from DAP‐seq. The absolute value of each number indicates the distance from the start codon. (b) Y1H assay showing the direct binding of PpnGRF5‐1 to the elements in the PagCKX1 promoter. Blue colonies indicate a strong association of PpnGRF5‐1 with a specific promoter segment. (c) EMSA showing that the GST‐PpnGRF5‐1 recombinant protein binds to biotin‐labeled probes of PagCKXp‐1 (upper panel) and PagCKXp‐2 (lower panel). The probes were truncated from PagCKX1 promoter with putative binding sites (TGTCAG) and mutant probes is a mutated form of probes (Supporting Information Table S1). Here, 50 and 100 unlabeled probes and probe mutants were used in the competition experiment.
Fig. 6
Fig. 6
PpnGRF5‐1 directly represses the expression of the PagCKX1 gene. (a) Transient expression assays show that PpnGRF5‐1 directly represses the expression of PagCKX1. Representative images of Nicotiana benthamiana leaves 48 h after infiltration were shown. (b) Quantitative analysis of luminescence intensity in (a). Values shown are mean ± SD (n = 5). **, P < 0.01 (by Student’s t‐test). Five independent determinations were assessed. (c) Dual‐LUC assay of PagCKX1p::LUC expression. The expression of REN was used as an internal control. LUC/REN ration represents the relative activity of the PagCKX1 promoter. Values given are mean ± SD (n = 3). **, P < 0.01 (by Student’s t‐test). (d, e) RT‐qPCR analysis of PagCKX1 expression. The RNA was extracted from 84K protoplasts transformed PpnGRF5‐1 after 36 h, and from PpnGRF5‐1‐overexpression lines. Values shown are mean ± SD (n = 3). *, P < 0.05; **, P < 0.01 (determined by Student’s t‐test.)
Fig. 7
Fig. 7
A three‐layered GRN mediated by PpnGRF5‐1. Each line represents a regulatory relationship inferred by top‐down GGM algorithm and validated by DAP‐seq, and each node in Layer 2 denotes a direct target gene while each dot at Layer 3 represents an indirect target gene of PpnGRF5‐1.
Fig. 8
Fig. 8
A holistic model that reflects the role of PpnGRF5‐1 in cell division and expansion. Each solid line denotes a direct regulatory relationship that has been proven by existing literature or our experiment data (Y1H and EMAS), whereas each dashed line denotes a potential regulatory relationship we predicted by combining top‐down GGM algorithm and DAP‐seq experiment.

Similar articles

Cited by

References

    1. Alvarez JP, Furumizu C, Efroni I, Eshed Y, Bowman JL. 2016. Active suppression of a leaf meristem orchestrates determinate leaf growth. eLife 5: e15023. - PMC - PubMed
    1. Anders S, Pyl PT, Huber W. 2015. HTSeq – a Python framework to work with high‐throughput sequencing data. Bioinformatics 31: 166–169. - PMC - PubMed
    1. Auger DL, Gray AD, Ream TS, Kato A, Coe EHJ, Birchler JA. 2005. Nonadditive gene expression in diploid and triploid hybrids of maize. Genetics 169: 389–397. - PMC - PubMed
    1. Bartlett A, O'Malley RC, Huang S‐SC, Galli M, Nery JR, Gallavotti A, Ecker JR. 2017. Mapping genome‐wide transcription‐factor binding sites using DAP‐seq. Nature Protocols 12: 1659–1672. - PMC - PubMed
    1. Benjamini Y, Hochberg Y. 1995. Controlling the false discovery rate: a practical and powerful approach to multiple testing. Journal of the Royal Statistical Society: Series B (Methodological) 57: 289–300.

Publication types

LinkOut - more resources