

Identification of key modules and hub genes in glioblastoma multiforme based on co-expression network analysis
- PMID: 33423377
- PMCID: PMC7931238
- DOI: 10.1002/2211-5463.13078
Identification of key modules and hub genes in glioblastoma multiforme based on co-expression network analysis
Abstract
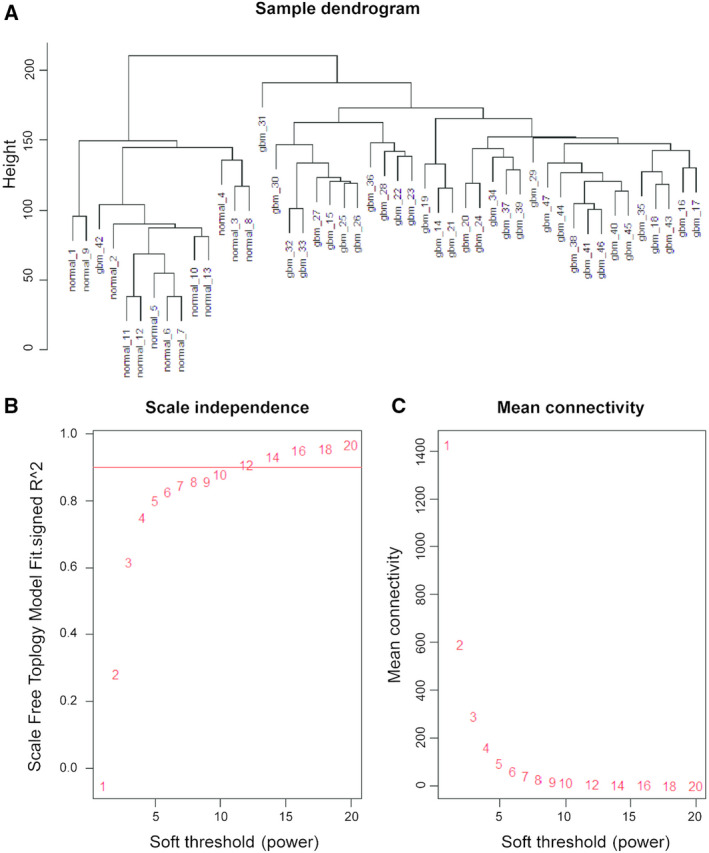
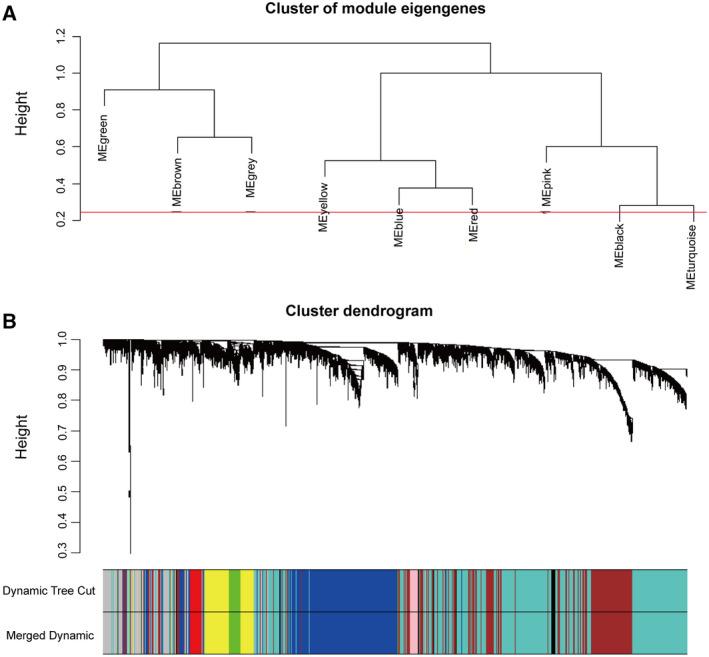
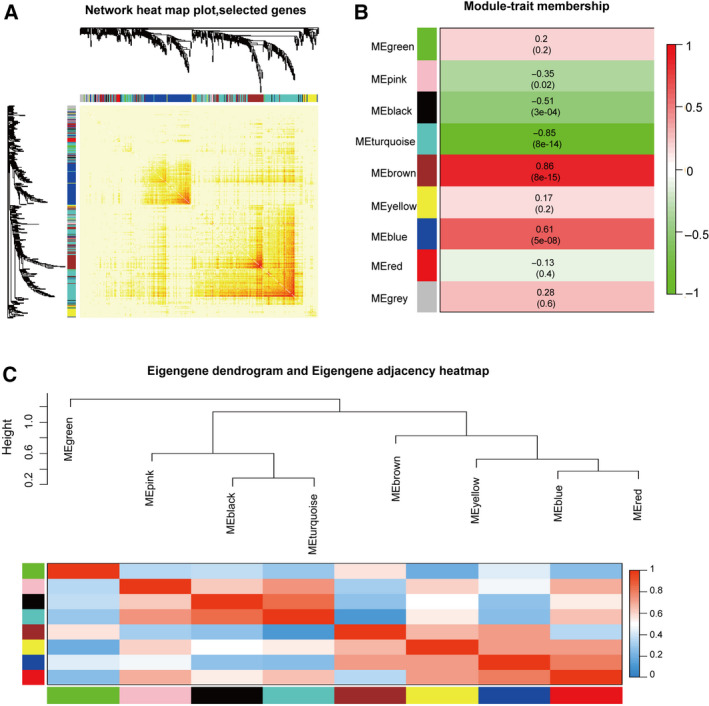
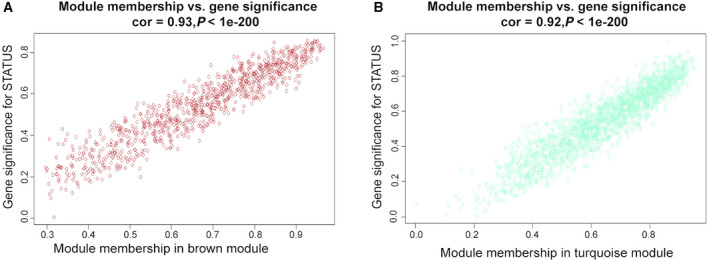
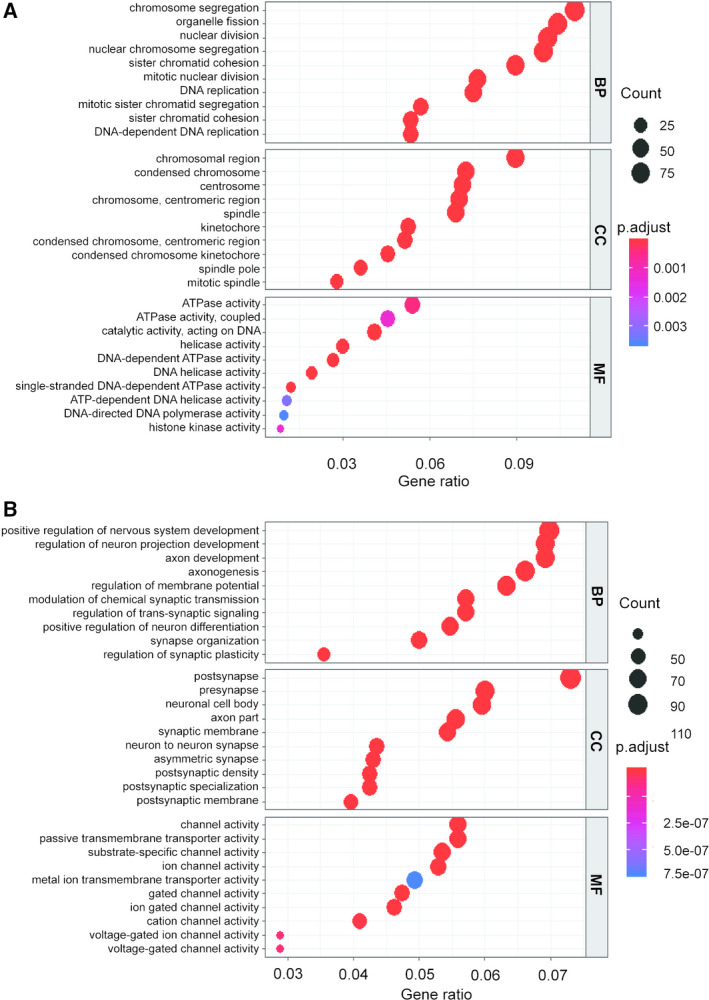
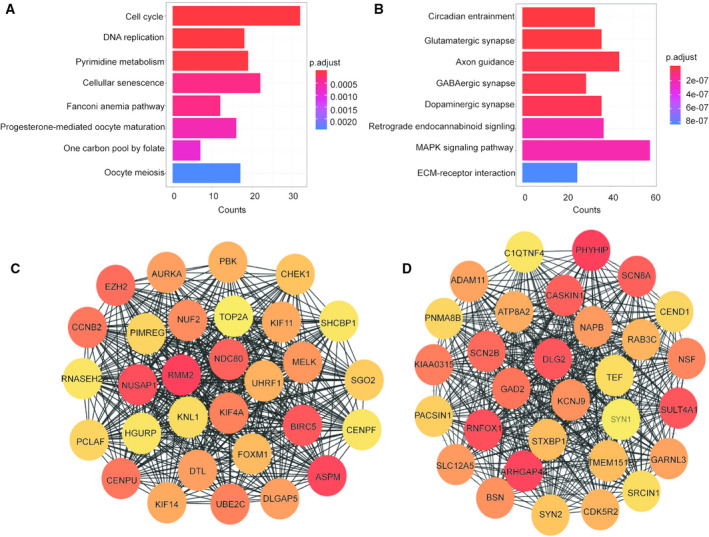
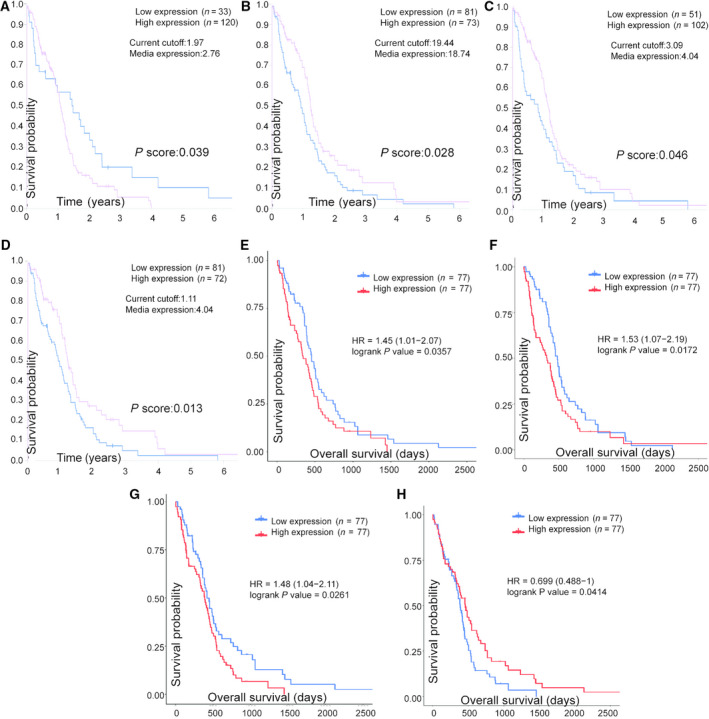
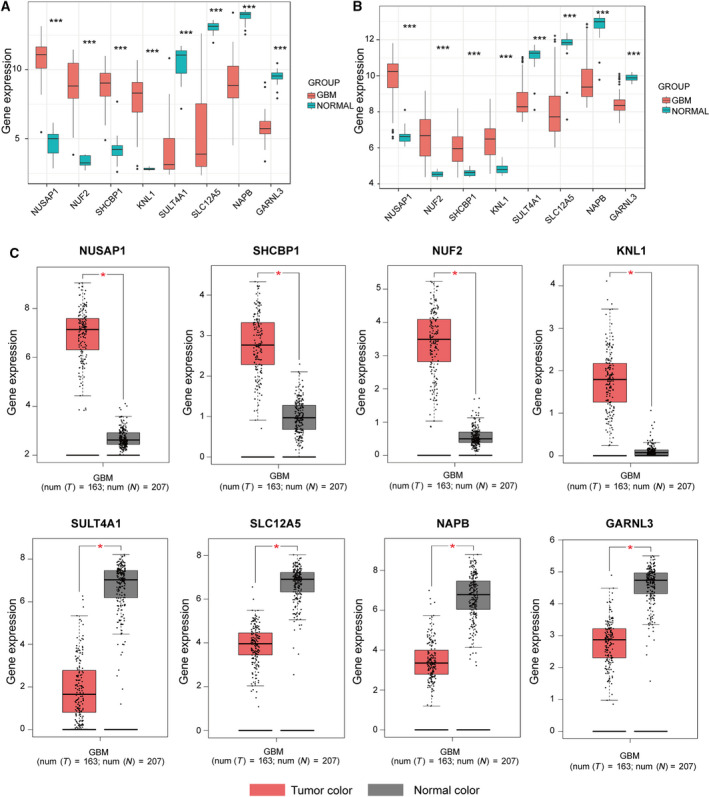
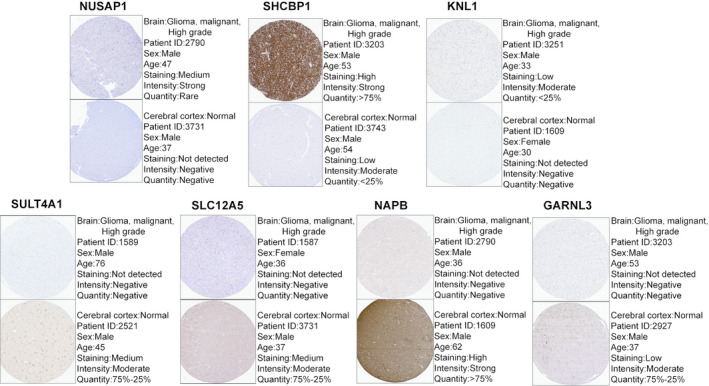
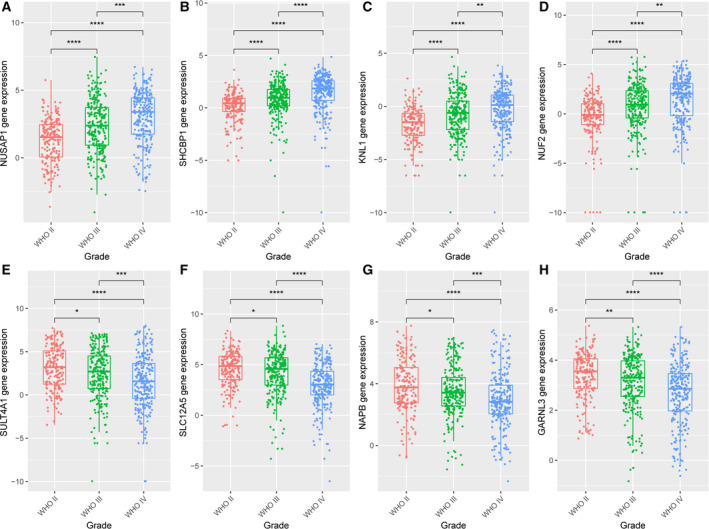
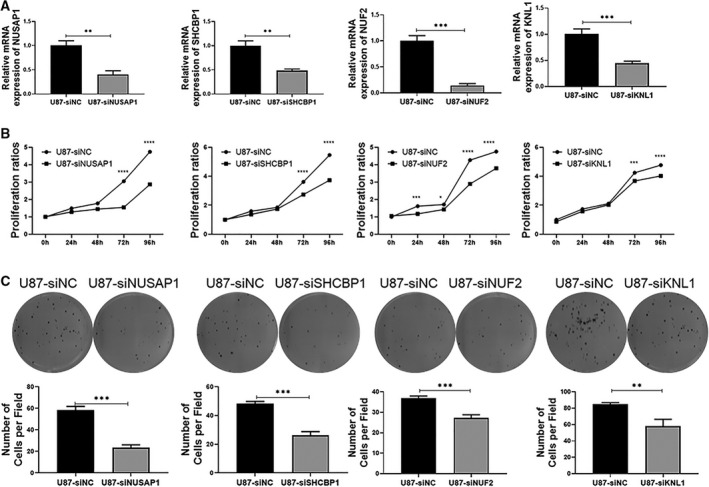
Glioblastoma multiforme (GBM) is the most malignant primary tumour in the central nervous system, but the molecular mechanisms underlying its pathogenesis remain unclear. In this study, data set GSE50161 was used to construct a co-expression network for weighted gene co-expression network analysis. Two modules (dubbed brown and turquoise) were found to have the strongest correlation with GBM. Functional enrichment analysis indicated that the brown module was involved in the cell cycle, DNA replication, and pyrimidine metabolism. The turquoise module was primarily related to circadian rhythm entrainment, glutamatergic synapses, and axonal guidance. Hub genes were screened by survival analysis using The Cancer Genome Atlas and Human Protein Atlas databases and further tested using the GSE4290 and Gene Expression Profiling Interactive Analysis databases. The eight hub genes (NUSAP1, SHCBP1, KNL1, SULT4A1, SLC12A5, NUF2, NAPB, and GARNL3) were verified at both the transcriptional and translational levels, and these gene expression levels were significant based on the World Health Organization classification system. These hub genes may be potential biomarkers and therapeutic targets for the accurate diagnosis and management of GBM.
Keywords: TCGA; WGCNA; biomarkers; glioblastoma multiforme; survival.
© 2021 The Authors. FEBS Open Bio published by John Wiley & Sons Ltd on behalf of Federation of European Biochemical Societies.
Conflict of interest statement
The authors declare no conflict of interest.
Figures
Similar articles
-
Construction of co-expression modules related to survival by WGCNA and identification of potential prognostic biomarkers in glioblastoma.J Cell Mol Med. 2021 Feb;25(3):1633-1644. doi: 10.1111/jcmm.16264. Epub 2021 Jan 15. J Cell Mol Med. 2021. PMID: 33449451 Free PMC article.
-
SLC12A5 as a novel potential biomarker of glioblastoma multiforme.Mol Biol Rep. 2023 May;50(5):4285-4299. doi: 10.1007/s11033-023-08371-y. Epub 2023 Mar 14. Mol Biol Rep. 2023. PMID: 36917367
-
Screening the Significant Hub Genes by Comparing Tumor Cells, Normoxic and Hypoxic Glioblastoma Stem-like Cell Lines Using Co-Expression Analysis in Glioblastoma.Genes (Basel). 2022 Mar 15;13(3):518. doi: 10.3390/genes13030518. Genes (Basel). 2022. PMID: 35328072 Free PMC article.
-
mRNA markers for survival prediction in glioblastoma multiforme patients: a systematic review with bioinformatic analyses.BMC Cancer. 2024 May 21;24(1):612. doi: 10.1186/s12885-024-12345-z. BMC Cancer. 2024. PMID: 38773447 Free PMC article.
-
Systems Biology Approaches to Decipher the Underlying Molecular Mechanisms of Glioblastoma Multiforme.Int J Mol Sci. 2021 Dec 8;22(24):13213. doi: 10.3390/ijms222413213. Int J Mol Sci. 2021. PMID: 34948010 Free PMC article. Review.
Cited by
-
Integrated Transcriptome Profiling Identifies Prognostic Hub Genes as Therapeutic Targets of Glioblastoma: Evidenced by Bioinformatics Analysis.ACS Omega. 2022 Jun 22;7(26):22531-22550. doi: 10.1021/acsomega.2c01820. eCollection 2022 Jul 5. ACS Omega. 2022. PMID: 35811900 Free PMC article.
-
GARNL3 identified as a crucial target for overcoming temozolomide resistance in EGFRvIII-positive glioblastoma.Am J Transl Res. 2024 May 15;16(5):1550-1567. doi: 10.62347/TFUT3720. eCollection 2024. Am J Transl Res. 2024. PMID: 38883343 Free PMC article.
-
Discovery of key molecular signatures for diagnosis and therapies of glioblastoma by combining supervised and unsupervised learning approaches.Sci Rep. 2024 Nov 11;14(1):27545. doi: 10.1038/s41598-024-79391-2. Sci Rep. 2024. PMID: 39528802 Free PMC article.
-
Identifying behavior regulatory leverage over mental disorders transcriptomic network hubs toward lifestyle-dependent psychiatric drugs repurposing.Hum Genomics. 2025 Mar 19;19(1):29. doi: 10.1186/s40246-025-00733-w. Hum Genomics. 2025. PMID: 40102990 Free PMC article.
-
Inhibiting microcephaly genes as alternative to microtubule targeting agents to treat brain tumors.Cell Death Dis. 2021 Oct 18;12(11):956. doi: 10.1038/s41419-021-04259-6. Cell Death Dis. 2021. PMID: 34663805 Free PMC article. Review.
References
-
- Louis DN, Perry A, Reifenberger G, von Deimling A, Figarella‐Branger D, Cavenee WK, Ohgaki H, Wiestler OD, Kleihues P and Ellison DW (2016) The 2016 World Health Organization classification of tumors of the central nervous system: a summary. Acta Neuropathol 131, 803–820. - PubMed
-
- Masui K, Mischel PS and Reifenberger G (2016) Molecular classification of gliomas. Handb Clin Neurol 134, 97–120. - PubMed
Publication types
MeSH terms
Substances
LinkOut - more resources
Full Text Sources
Other Literature Sources
Medical
Research Materials
