. 2021 Jan 11;19(1):7.
doi: 10.1186/s12916-020-01848-8.

Associations of six adiposity-related markers with incidence and mortality from 24 cancers-findings from the UK Biobank prospective cohort study

Affiliations

Associations of six adiposity-related markers with incidence and mortality from 24 cancers-findings from the UK Biobank prospective cohort study

Solange Parra-Soto et al. BMC Med. .

Abstract

Background: Adiposity is a strong risk factor for cancer incidence and mortality. However, most of the evidence available has focused on body mass index (BMI) as a marker of adiposity. There is limited evidence on relationships of cancer with other adiposity markers, and if these associations are linear or not. The aim of this study was to investigate the associations of six adiposity markers with incidence and mortality from 24 cancers by accounting for potential non-linear associations.

Methods: A total of 437,393 participants (53.8% women; mean age 56.3 years) from the UK Biobank prospective cohort study were included in this study. The median follow-up was 8.8 years (interquartile range 7.9 to 9.6) for mortality and 9.3 years (IQR 8.6 to 9.9) for cancer incidence. Adiposity-related exposures were BMI, body fat percentage, waist-hip ratio, waist-height ratio, and waist and hip circumference. Incidence and mortality of 24 cancers sites were the outcomes. Cox proportional hazard models were used with each of the exposure variables fitted separately on penalised cubic splines.

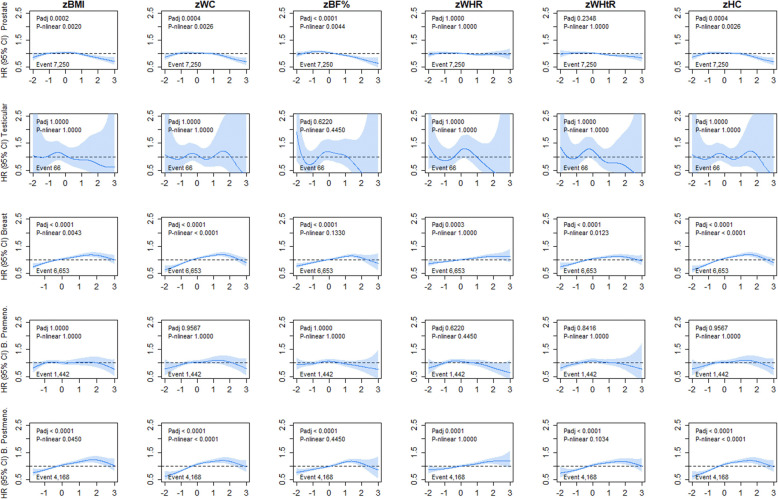
Results: During follow-up, 47,882 individuals developed cancer and 11,265 died due to cancer during the follow-up period. All adiposity markers had similar associations with overall cancer incidence. BMI was associated with a higher incidence of 10 cancers (stomach cardia (hazard ratio per 1 SD increment 1.35, (95% CI 1.23; 1.47)), gallbladder (1.33 (1.12; 1.58)), liver (1.27 (1.19; 1.36)), kidney (1.26 (1.20; 1.33)), pancreas (1.12 (1.06; 1.19)), bladder (1.09 (1.04; 1.14)), colorectal (1.10 (1.06; 1.13)), endometrial (1.73 (1.65; 1.82)), uterine (1.68 (1.60; 1.75)), and breast cancer (1.08 (1.05; 1.11))) and overall cancer (1.03 (1.02; 1.04)). All these associations were linear except for breast cancer in postmenopausal women. Similar results were observed when other markers of central and overall adiposity were used. For mortality, nine cancer sites were linearly associated with BMI and eight with waist circumference and body fat percentage.

Conclusion: Adiposity, regardless of the marker used, was associated with an increased risk in 10 cancer sites.

Keywords: Body fat; Body mass index; Cancer; Obesity; UK Biobank; Waist circumference.


Conflict of interest statement

No to declare.

Figures

Fig. 1
Fig. 1
Association of adiposity markers with overall, liver, pancreatic, and colorectal cancer incidence. Penalised splines were used to present the association between adiposity markers and cancer outcomes. The adiposity markers were sex-standardised to 1-SD increment. Analyses were adjusted for age, sex and ethnicity, education, deprivation, smoking, dietary intake (alcohol, fruits and vegetables, red and processed meat, and oily fish), physical activity and sedentary behaviour. BMI, body mass index; BF%, body fat percentage; WHR, waist-hip ratio; WHtR, waist-height ratio; HC, hip circumference; HR, hazard ratio. Shaded areas represent 95% confidence intervals. All P values were corrected for multiple testing by using the Holm’s method. Participants classified as underweight (BMI < 18.5 kg/m2 were excluded from the analyses (n = 2629)
Fig. 2
Fig. 2
Association of adiposity markers with gallbladder and stomach cancer incidence. Penalised splines were used to present the association between adiposity markers and cancer outcomes. The adiposity markers were sex-standardised to 1-SD increment. Analyses were adjusted for age, sex and ethnicity, education, deprivation, smoking, dietary intake (alcohol, fruits and vegetables, red and processed meat, and oily fish), physical activity and sedentary behaviour. BMI, body mass index; BF%, body fat percentage; WHR, waist-hip ratio; WHtR, waist-height ratio; HC, hip circumference; HR, hazard ratio. Shaded areas represent 95% confidence intervals. All P values were corrected for multiple testing by using the Holm’s method. Participants classified as underweight (BMI < 18.5 kg/m2 were excluded from the analyses (n = 2629)
Fig. 3
Fig. 3
Association of adiposity markers with oesophageal, oral, and lung cancer incidence in never smoker. Penalised splines were used to present the association between adiposity markers and cancer outcomes. The adiposity markers were sex-standardised to 1-SD increment. Analyses were adjusted for age, sex and ethnicity, education, deprivation, dietary intake (alcohol, fruits and vegetables, red and processed meat, and oily fish), physical activity and sedentary behaviour. BMI, body mass index; BF%, body fat percentage; WHR, waist-hip ratio; WHtR, waist-height ratio; HC, hip circumference; HR, hazard ratio. Shaded areas represent 95% confidence intervals. All P values were corrected for multiple testing by using the Holm’s method. Participants classified as underweight (BMI < 18.5 kg/m2 were excluded from the analyses (n = 2629)
Fig. 4
Fig. 4
Association of adiposity markers with lymphatic cancer incidence. Penalised splines were used to present the association between adiposity markers and cancer outcomes. The adiposity markers were sex-standardised to 1-SD increment. Analyses were adjusted for age, sex and ethnicity, education, deprivation, smoking, dietary intake (alcohol, fruits and vegetables, red and processed meat, and oily fish), physical activity and sedentary behaviour. BMI, body mass index; BF%, body fat percentage; WHR, waist-hip ratio; WHtR, waist-height ratio; HC, hip circumference; HR, hazard ratio. Shaded areas represent 95% confidence intervals. All P values were corrected for multiple testing by using the Holm’s method. Participants classified as underweight (BMI < 18.5 kg/m2 were excluded from the analyses (n = 2629)
Fig. 5
Fig. 5
Association of adiposity markers with women-specific cancer incidence. Penalised splines were used to present the association between adiposity markers and cancer outcomes. The adiposity markers were sex-standardised to 1-SD increment. Analyses were adjusted for age, sex and ethnicity, education, deprivation, smoking, dietary intake (alcohol, fruits and vegetables, red and processed meat, and oily fish), physical activity and sedentary behaviour. BMI, body mass index; BF%, body fat percentage; WHR, waist ratio; WHtR, waist-height ratio; HC, hip circumference; HR, hazard ratio. Shaded areas represent 95% confidence intervals. All P values were corrected for multiple testing by using the Holm’s method. Participants classified as underweight (BMI < 18.5 kg/m2 were excluded from the analyses (n = 2629)
Fig. 6
Fig. 6
Association of adiposity markers with prostate, testicular cancer in men and breast cancer (overall, pre and post menopausal) incidence. Penalised splines were used to present the association between adiposity markers and cancer outcomes. The adiposity markers were sex-standardised to 1-SD increment. Analyses were adjusted for age, sex and ethnicity, education, deprivation, smoking, dietary intake (alcohol, fruits and vegetables, red and processed meat, and oily fish), physical activity and sedentary behaviour. BMI, body mass index; BF%, body fat percentage; WHR, waist-hip ratio; WHtR, waist-height ratio; HC, hip circumference; HR, hazard ratio. Shaded areas represent 95% confidence intervals. All P values were corrected for multiple testing by using the Holm’s method. Participants classified as underweight (BMI < 18.5 kg/m2 were excluded from the analyses (n = 2629)
Fig. 7
Fig. 7
Association of adiposity markers with brain, melanoma, thyroid, bladder, and kidney cancer incidence. Penalised splines were used to present the association between adiposity markers and cancer outcomes. The adiposity markers were sex-standardised to 1-SD increment. Analyses were adjusted for age, sex and ethnicity, education, deprivation, smoking, dietary intake (alcohol, fruits and vegetables, red and processed meat, and oily fish), physical activity and sedentary behaviour. BMI, body mass index; BF%, body fat percentage; WHR, waist-hip ratio; WHtR, waist-height ratio; HC, hip circumference; HR, hazard ratio. Shaded areas represent 95% confidence intervals. All P values were corrected for multiple testing by using the Holm’s method. Participants classified as underweight (BMI < 18.5 kg/m2 were excluded from the analyses (n = 2629)
Fig. 8
Fig. 8
Population attributable fraction (PAF) for cancer incidence and mortality attributable to have a BMI ≥ 25 kg/m2. Data are presented in percentages. Analyses were adjusted for age, sex and ethnicity, education, deprivation, smoking, dietary intake (alcohol, fruits and vegetables, red and processed meat, and oily fish), physical activity and sedentary behaviour. Breast cancer was additionally adjusted for age at menarche, hormonal replacement, and age at first and last live birth. Normal BMI (18.5 to 24.9 kg/m2) was used as the reference group and compared with individuals with BMI ≥ 25 kg/m2)

Similar articles

Cited by

References

    1. Mokdad AH, Ford ES, Bowman BA, Dietz WH, Vinicor F, Bales VS, et al. Prevalence of obesity, diabetes, and obesity-related health risk factors, 2001. Jama-J Am Med Assoc. 2003;289(1):76–79. doi: 10.1001/jama.289.1.76. - DOI - PubMed
    1. Bhaskaran K, Douglas I, Forbes H, dos-Santos-Silva I, Leon DA, Smeeth L. Body-mass index and risk of 22 specific cancers: a population-based cohort study of 5.24 million UK adults. Lancet. 2014;384(9945):755–765. - PMC - PubMed
    1. World Cancer Research Fund. Continuous Update Project Expert Report 2018. Body fatness and weight gain and the risk of cancer 2018.
    1. Freisling H, Arnold M, Soerjomataram I, O'Doherty MG, Ordonez-Mena JM, Bamia C, et al. Comparison of general obesity and measures of body fat distribution in older adults in relation to cancer risk: meta-analysis of individual participant data of seven prospective cohorts in Europe. Br J Cancer. 2017;116(11):1486–1497. doi: 10.1038/bjc.2017.106. - DOI - PMC - PubMed
    1. Keimling M, Renehan AG, Behrens G, Fischer B, Hollenbeck AR, Cross AJ, et al. Comparison of associations of body mass index, abdominal adiposity, and risk of colorectal cancer in a large prospective cohort study. Cancer Epidemiol Biomark Prev. 2013;22(8):1383–1394. doi: 10.1158/1055-9965.EPI-13-0353. - DOI - PubMed

Publication types

Substances