. 2021 Feb;16(2):754-774.
doi: 10.1038/s41596-020-00432-x. Epub 2021 Jan 11.

A robust unsupervised machine-learning method to quantify the morphological heterogeneity of cells and nuclei

Affiliations

A robust unsupervised machine-learning method to quantify the morphological heterogeneity of cells and nuclei

Jude M Phillip et al. Nat Protoc. 2021 Feb.

Abstract

Cell morphology encodes essential information on many underlying biological processes. It is commonly used by clinicians and researchers in the study, diagnosis, prognosis, and treatment of human diseases. Quantification of cell morphology has seen tremendous advances in recent years. However, effectively defining morphological shapes and evaluating the extent of morphological heterogeneity within cell populations remain challenging. Here we present a protocol and software for the analysis of cell and nuclear morphology from fluorescence or bright-field images using the VAMPIRE algorithm ( https://github.com/kukionfr/VAMPIRE_open ). This algorithm enables the profiling and classification of cells into shape modes based on equidistant points along cell and nuclear contours. Examining the distributions of cell morphologies across automatically identified shape modes provides an effective visualization scheme that relates cell shapes to cellular subtypes based on endogenous and exogenous cellular conditions. In addition, these shape mode distributions offer a direct and quantitative way to measure the extent of morphological heterogeneity within cell populations. This protocol is highly automated and fast, with the ability to quantify the morphologies from 2D projections of cells seeded both on 2D substrates or embedded within 3D microenvironments, such as hydrogels and tissues. The complete analysis pipeline can be completed within 60 minutes for a dataset of ~20,000 cells/2,400 images.


Figures

Fig. 1 ∣
Fig. 1 ∣. Cells confined to narrow ranges of traditional morphological parameters still exhibit highly variable shapes.
Scatter plot showing the distributions of 37,750 mouse embryonic fibroblast cells confined to a 3D axis of aspect ratio, shape factor, and solidity. The subset of 10 cells highlighted in red display substantial morphological heterogeneity, despite highly similar values of aspect ratio, circularity, and solidity.
Fig. 2 ∣
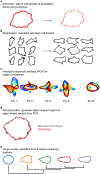
Fig. 2 ∣. Overview of VAMPIRE analysis, from the extraction of contour coordinates to the automatic generation of shape modes.
a, The contour of a single cell described by 50 equidistant points along its contour. b, Unaligned (left) shapes of a set of cells are pooled, normalized by size, and aligned (right). c, Eigenshape vectors (i.e., principal components or PCs) are obtained from a principal component analysis (PCA) of the contour coordinates of aligned cells. d, Reconstructed cell shape from a reduced number of eigenshape vectors. The reduced number of eigenshape vectors was defaulted to the number of vectors that comprise 95% of the shape variations among all assessed cells. e, Representative cellular shape modes are obtained by applying a K-means clustering method to a set of cell morphology data described by the reduced number of eigenshape vectors.
Fig. 3 ∣
Fig. 3 ∣. Overview of VAMPIRE implementation with the VAMPIRE GUI.
a, The VAMPIRE Graphical User Interface (GUI). b, Flow diagram illustrating key steps in the implementation of VAMPIRE analysis with VAMPIRE GUI. Images of cells are first segmented into binary images that highlight the cellular region and/or nuclear region. The VAMPIRE GUI top section (highlighted in red) allows users to specify analysis parameters and the location of segmented images to be used to create a VAMPIRE analysis model. Once the VAMPIRE analysis model is established, the user can specify the sets of segmented images to be analyzed using the previously established model (highlighted in blue).
Fig. 4 ∣
Fig. 4 ∣. Determinants of cluster coherence in the shape mode distributions.
a, Schematic illustrating the concept of inertia in K-means clustering. The inertia is measured by total squared distances of all data points to the centroids of their corresponding subtype. A lower inertia value indicates better segregation of clusters indicating more intercluster coherence. b, The inertia in principle decays with an increasing number of clusters. The corresponding cluster number at the elbow point where the inertia decay rate starts to drop is the suggested cluster number to use in VAMPIRE for K-means clustering. The example inertia profile is calculated based on 17,093 MEF cells. The inertia value is calculated on ten separate runs of VAMPIRE analysis at each cluster number parameter value. In each run, the K-means clustering is by default repeated five times with different centroid seeds to find the initial seed that results in the lowest inertia value. The coefficient of variation of inertia between ten separate runs of VAMPIRE is less than 0.05% for this inertia profile, thus an error bar is not shown.
Fig. 5 ∣
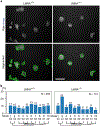
Fig. 5 ∣. VAMPIRE analysis of LMNA+/+ and LMNA−/− mouse embryonic fibroblasts.
a, Images of phalloidin-stained (top) wild-type (LMNA+/+, left) and lamin-deficient (LMNA−/−, right) mouse embryonic fibroblasts. Segmentation is obtained using CellProfiler. Scale bar, 100 μm. b, Bar plots showing the distribution of cell shape modes from the VAMPIRE analysis of the MEFs. Numbers above the bars represent the abundances (%) of cells in each shape mode.
Fig. 6 ∣
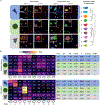
Fig. 6 ∣. VAMPIRE analysis of mouse embryonic fibroblasts seeded on adhesive micro-patterned surfaces.
a, Fluorescence microscopy images of wild-type (LMNA+/+) and lamin-deficient (LMNA−/−) mouse embryonic fibroblasts cultured on circular (top row) and triangular (middle row) adhesive fibronectin-coated micropatterns. Control cells (bottom row) are placed on the fibronectin-coated glass. Cells were fixed and stained for F-actin using Alexa Fluor 488 Phalloidin (red) and nuclear DNA using DAPI (blue). Segmented fluorescence images (right). On the left are the raw images of cells and their nuclei with the segmented contours highlighted in yellow; on the right are the same cells color coded according to the shape mode to which they belong. Scale bar, 100 μm. Inserts are magnified views of cells; scale bar, 50 μm. The identified shape modes are located on the right of the panel. b, The table on the left shows the frequency of cells classified within each shape mode for LMNA+/+ and LMNA−/− cells cultured on circular or triangular micropatterns (top and middle rows) and unpatterned surfaces (bottom row). The table on the right displays the values for traditional morphological parameters, including average area, shape factor (SF), and aspect ratio (AR) of cells, as well as the number of cells analyzed (#), lamin A/C status and the Shannon entropy of the cells. These results indicate that traditional morphological parameters insufficiently discriminate between the nuclear morphological responses of LMNA+/+ and LMNA−/− on different adhesive micropatterns (right table). By contrast, the differential morphological response of these cells is readily revealed when measured by shape mode distributions (left color-coded table). The reported values for each condition are the average abundance of cells based on two replicates of the same condition.
Fig. 7 ∣
Fig. 7 ∣. VAMPIRE analysis of human dermal fibroblasts from donors of different ages.
a, Distributions of nuclear shape modes for dermal fibroblasts from age 3 to 96. Each row shows the distribution of shape modes for each donor. The number of nuclei assessed are: # = 643, 420, 407, 531, 373, 575, 637, respectively. The sample numbers of nuclei for each cell line are from two distinct replicates. Cells from younger donors populate the rounder shape modes (modes 1 and 2), while cells from older donors have nuclei classified that populate the irregular shape modes (modes 3, 4, and 7). b, Table showing Pearson’s correlation (R), shape factor (SF), and aspect ratio (AR) of each nuclear shape mode. R is the age correlation based on the abundance of nuclei in a specific shape mode. SF and AR are calculated as the mean of all nuclei classified in each shape mode across all ages.
Fig. 8 ∣
Fig. 8 ∣. Analysis of nuclear shape in H&E stained tissue sections with VAMPIRE.
a, Images of a skin tissue section stained with hematoxylin and eosin (H&E) and obtained from the cancer genome atlas (TCGA case ID: TCGA-EE-A20I). Nuclei in the epidermis and the reticular dermis regions were segmented and analyzed with VAMPIRE. b, Bar graphs show the distribution of nuclei shape modes, comparing epidermal cells (N = 1,579) and dermal cells (N = 498) using VAMPIRE analysis. Numbers above the bars represent the abundances (%) of nuclei in each shape mode. Results also show a lower Shannon entropy in cells derived from the reticular dermis (S = 2.1) relative to cells from the epidermis (S = 2.25), indicating lower heterogeneity in the reticular dermis.

References

    1. Wu PH et al. Evolution of cellular morpho-phenotypes in cancer metastasis. Sci. Rep 5, 1–10 (2015). - PMC - PubMed
    1. Chen W-C et al. Functional interplay between the cell cycle and cell phenotypes. Integr. Biol 5, 523–34 (2013). - PMC - PubMed
    1. Chambliss AB, Wu PH, Chen WC, Sun SX & Wirtz D Simultaneously defining cell phenotypes, cell cycle, and chromatin modifications at single-cell resolution. FASEB J 27, 2667–2676 (2013). - PMC - PubMed
    1. Bakal C, Aach J, Church G & Perrimon N Quantitative morphological signatures define local signaling networks regulating cell morphology. Science 316, 1753–1756 (2007). - PubMed
    1. Rohban MH et al. Systematic morphological profiling of human gene and allele function via cell painting. eLife 6, e24060 (2017). - PMC - PubMed

Publication types