

The impact of modelling choices on modelling outcomes: a spatio-temporal study of the association between COVID-19 spread and environmental conditions in Catalonia (Spain)
- PMID: 33424434
- PMCID: PMC7778699
- DOI: 10.1007/s00477-020-01965-z
The impact of modelling choices on modelling outcomes: a spatio-temporal study of the association between COVID-19 spread and environmental conditions in Catalonia (Spain)
Abstract
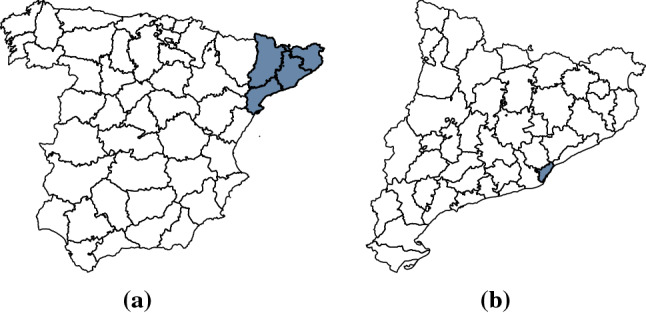
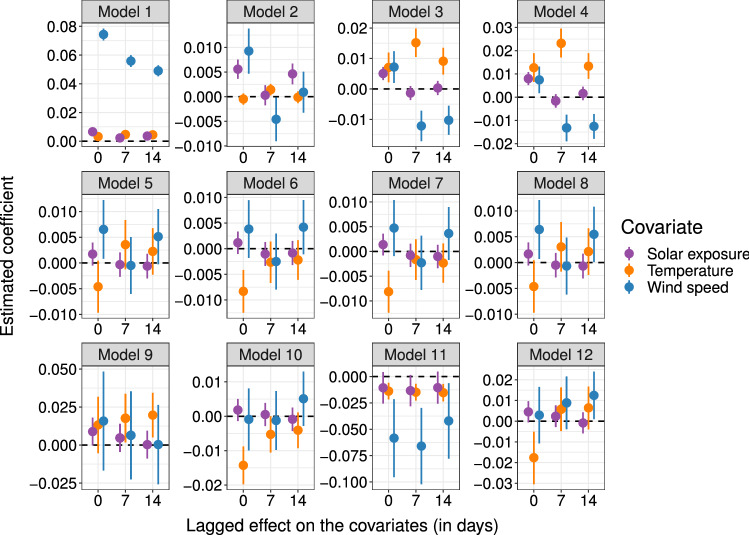
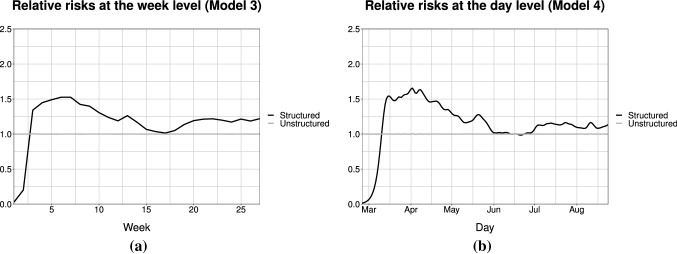
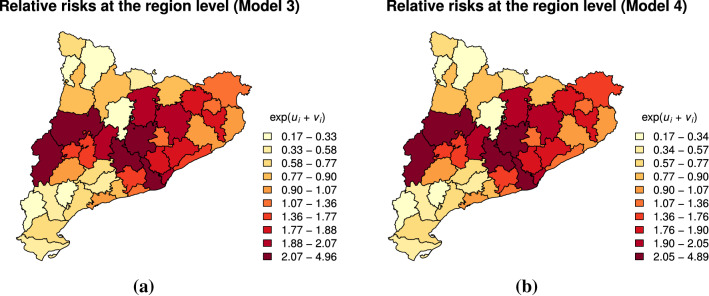
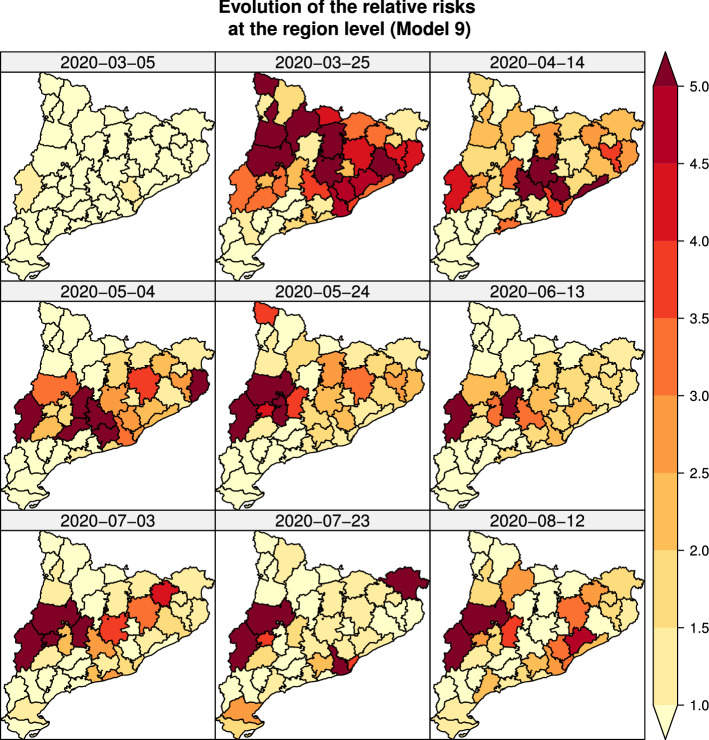
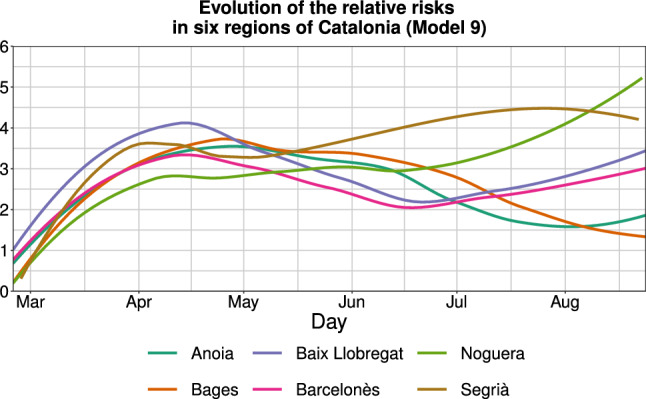
The choices that researchers make while conducting a statistical analysis usually have a notable impact on the results. This fact has become evident in the ongoing research of the association between the environment and the evolution of the coronavirus disease 2019 (COVID-19) pandemic, in light of the hundreds of contradictory studies that have already been published on this issue in just a few months. In this paper, a COVID-19 dataset containing the number of daily cases registered in the regions of Catalonia (Spain) since the start of the pandemic to the end of August 2020 is analysed using statistical models of diverse levels of complexity. Specifically, the possible effect of several environmental variables (solar exposure, mean temperature, and wind speed) on the number of cases is assessed. Thus, the first objective of the paper is to show how the choice of a certain type of statistical model to conduct the analysis can have a severe impact on the associations that are inferred between the covariates and the response variable. Secondly, it is shown how the use of spatio-temporal models accounting for the nature of the data allows understanding the evolution of the pandemic in space and time. The results suggest that even though the models fitted to the data correctly capture the evolution of COVID-19 in space and time, determining whether there is an association between the spread of the pandemic and certain environmental conditions is complex, as it is severely affected by the choice of the model.
Keywords: COVID-19; Environmental covariates; Integrated nested Laplace approximation; Relative risk; Space-time interaction; Spatio-temporal models.
© The Author(s), under exclusive licence to Springer-Verlag GmbH, DE part of Springer Nature 2021.
Conflict of interest statement
Conflict of interestThe author declare that they have no conflict of interest.
Figures
Similar articles
-
Bayesian spatio-temporal analysis of the COVID-19 pandemic in Catalonia.Sci Rep. 2024 Feb 20;14(1):4220. doi: 10.1038/s41598-024-53527-w. Sci Rep. 2024. PMID: 38378913 Free PMC article.
-
Modelling and predicting the spatio-temporal spread of cOVID-19 in Italy.BMC Infect Dis. 2020 Sep 23;20(1):700. doi: 10.1186/s12879-020-05415-7. BMC Infect Dis. 2020. PMID: 32967639 Free PMC article.
-
Bayesian spatio-temporal joint disease mapping of Covid-19 cases and deaths in local authorities of England.Spat Stat. 2022 Jun;49:100519. doi: 10.1016/j.spasta.2021.100519. Epub 2021 May 12. Spat Stat. 2022. PMID: 33996424 Free PMC article.
-
Spatial and spatio-temporal models with R-INLA.Spat Spatiotemporal Epidemiol. 2013 Mar;4:33-49. doi: 10.1016/j.sste.2012.12.001. Epub 2013 Jan 2. Spat Spatiotemporal Epidemiol. 2013. PMID: 23481252 Review.
-
Spatial and spatio-temporal models with R-INLA.Spat Spatiotemporal Epidemiol. 2013 Dec;7:39-55. doi: 10.1016/j.sste.2013.07.003. Spat Spatiotemporal Epidemiol. 2013. PMID: 24377114 Review.
Cited by
-
Artificial Intelligence for Forecasting the Prevalence of COVID-19 Pandemic: An Overview.Healthcare (Basel). 2021 Nov 23;9(12):1614. doi: 10.3390/healthcare9121614. Healthcare (Basel). 2021. PMID: 34946340 Free PMC article. Review.
-
Spatial regression models to assess variations of composite index for anthropometric failure across the administrative zones in Ethiopia.PLoS One. 2024 Feb 28;19(2):e0282463. doi: 10.1371/journal.pone.0282463. eCollection 2024. PLoS One. 2024. PMID: 38416735 Free PMC article.
-
Local-level spatiotemporal dynamics of COVID-19 transmission in the Greater Seoul Area, Korea: a view from a Bayesian perspective.Epidemiol Health. 2022;44:e2022016. doi: 10.4178/epih.e2022016. Epub 2022 Jan 13. Epidemiol Health. 2022. PMID: 35038828 Free PMC article.
-
Spatiotemporal Associations between Local Safety Level Index and COVID-19 Infection Risks across Capital Regions in South Korea.Int J Environ Res Public Health. 2022 Jan 12;19(2):824. doi: 10.3390/ijerph19020824. Int J Environ Res Public Health. 2022. PMID: 35055645 Free PMC article.
-
Epidemiological geography at work: An exploratory review about the overall findings of spatial analysis applied to the study of CoViD-19 propagation along the first pandemic year.GeoJournal. 2023;88(1):1103-1125. doi: 10.1007/s10708-022-10601-y. Epub 2022 Mar 29. GeoJournal. 2023. PMID: 35370348 Free PMC article. Review.
References
-
- Besag J, York J, Mollié A. Bayesian image restoration, with two applications in spatial statistics. Ann Inst Stat Math. 1991;43(1):1–20. doi: 10.1007/BF00116466. - DOI
-
- Bivand RS, Pebesma EJ, Gomez-Rubio V, Pebesma EJ. Applied spatial data analysis with R. Berlin: Springer; 2008.
-
- Bivand R, Keitt T, Rowlingson B (2019). rgdal: bindings for the ‘Geospatial’ Data Abstraction Library. R package version 1.4-6
LinkOut - more resources
Full Text Sources
Other Literature Sources