

The Performance of Olfactory Receptor Neurons: The Rate of Concentration Change Indicates Functional Specializations in the Cockroach Peripheral Olfactory System
- PMID: 33424623
- PMCID: PMC7793652
- DOI: 10.3389/fphys.2020.599086
The Performance of Olfactory Receptor Neurons: The Rate of Concentration Change Indicates Functional Specializations in the Cockroach Peripheral Olfactory System
Abstract
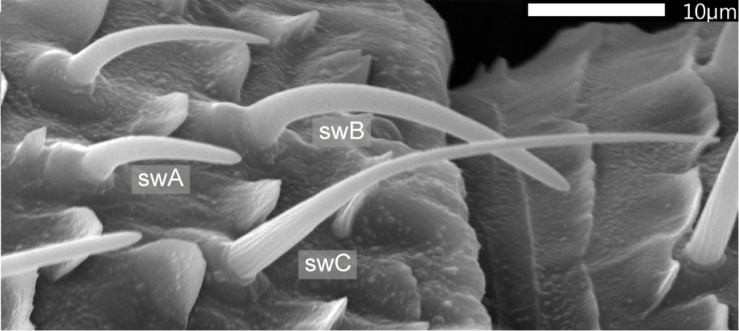
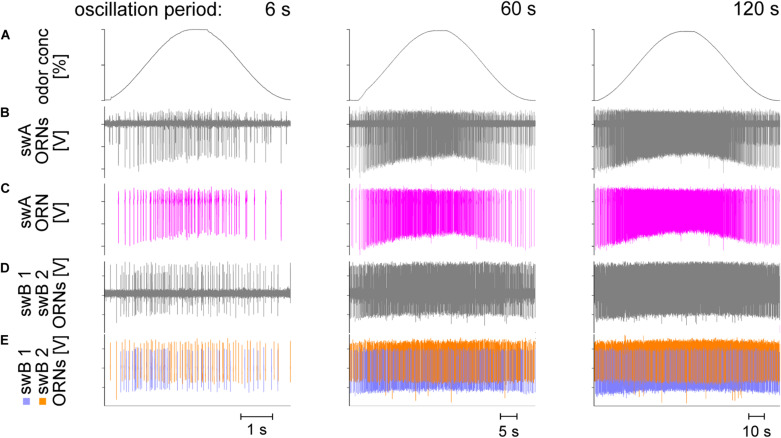
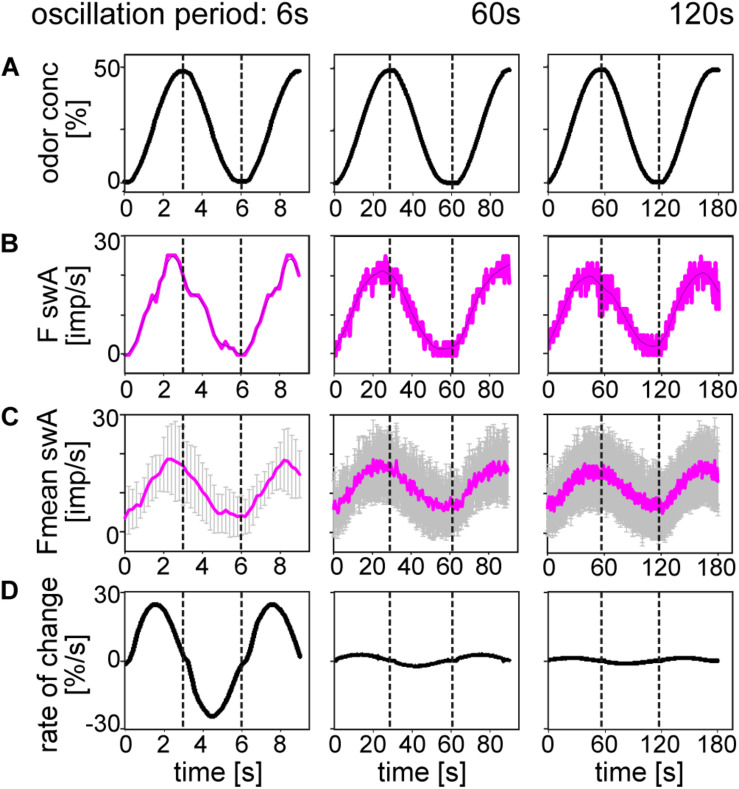
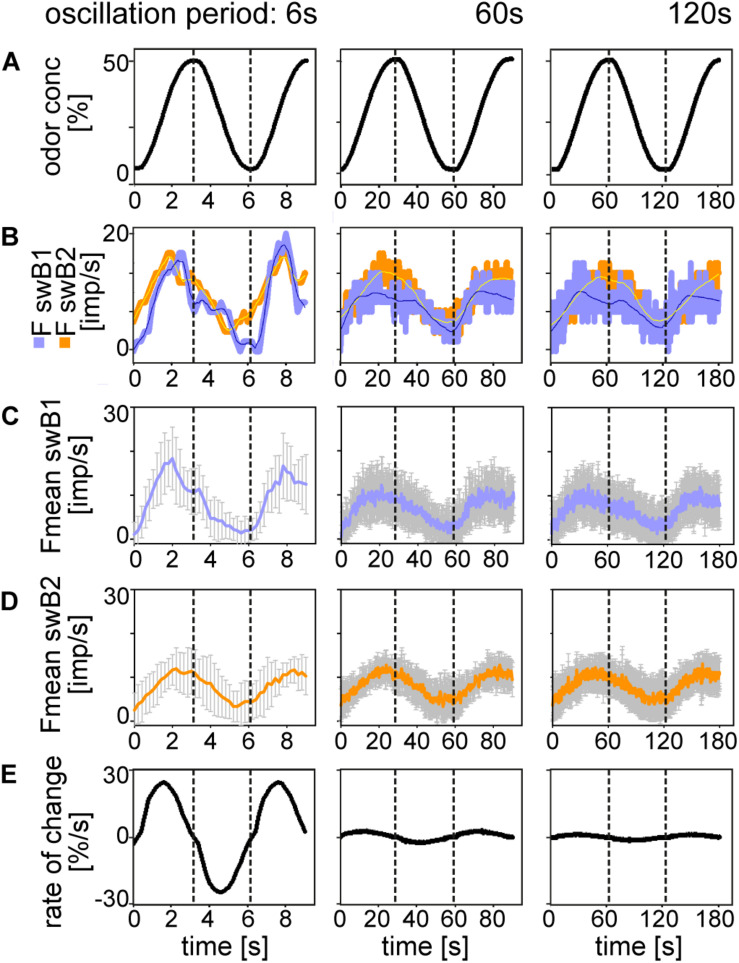
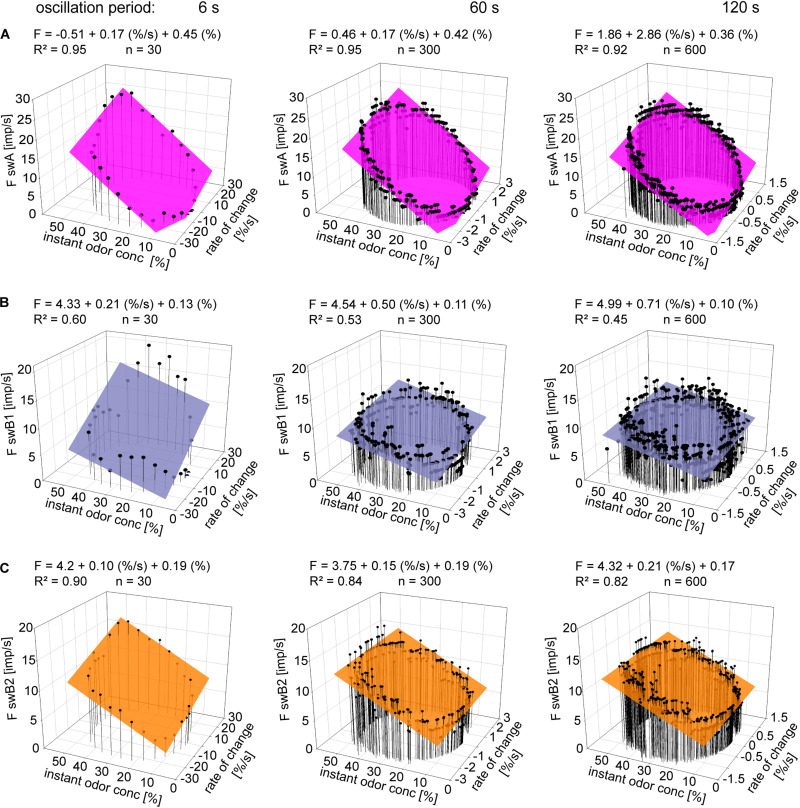
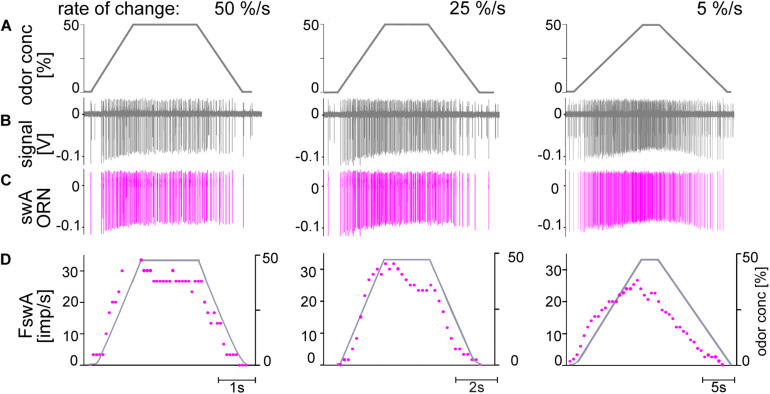
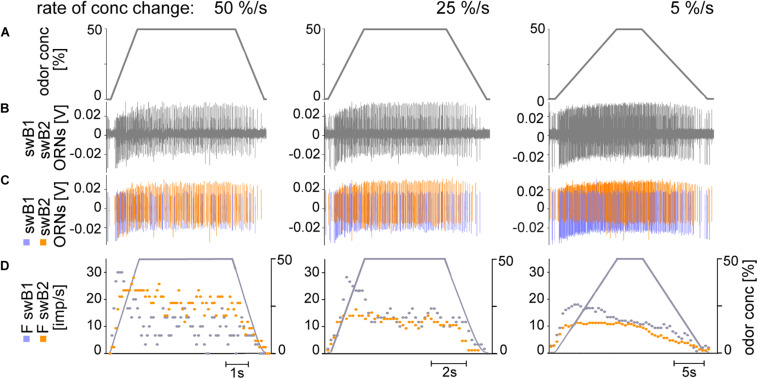
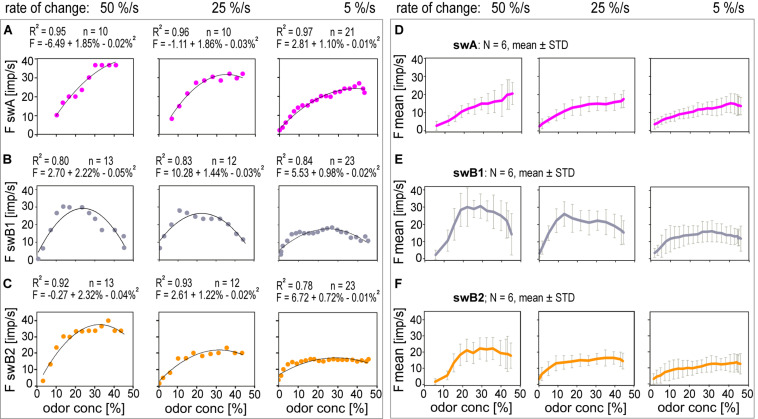
Slow and continuous changes in odor concentration were used as a possible easy method for measuring the effect of the instantaneous concentration and the rate of concentration change on the activity of the olfactory receptor neurons (ORNs) of basiconic sensilla on the cockroach antennae. During oscillating concentration changes, impulse frequency increased with rising instantaneous concentration and this increase was stronger the faster concentration rose through the higher concentration values. The effect of the concentration rate on the ORNs responses to the instantaneous concentration was invariant to the duration of the oscillation period: shallow concentration waves provided by long periods elicited the same response to the instantaneous concentration as steep concentration waves at brief periods. Thus, the double dependence remained unchanged when the range of concentration rates varied. This distinguishes the ORNs of basiconic sensilla from those of trichoid sensilla (Tichy and Hellwig, 2018) which adjust their gain of response according to the duration of the oscillating period. The precision of the ORNs to discriminate increments of slowly rising odor concentration was studied by applying gradual ramp-like concentration changes at different rates. While the ORNs of the trichoid sensilla perform better the slower the concentration rate, those of the basiconic sensilla show no preference for a specific rate of concentration increase. This suggests that the two types of sensilla have different functions. The ORNs of the trichoid sensilla may predominately analyze temporal features of the odor signal and the ORNs of the basiconic sensilla may be involved in extracting information on the identity of the odor source instead of mediating the spatial-temporal concentration pattern in an odor plume.
Keywords: cockroach; differential sensitivity; electrophysiology; food odor coding; resolving power.
Copyright © 2020 Tichy, Linhart, Martzok and Hellwig.
Conflict of interest statement
The authors declare that the research was conducted in the absence of any commercial or financial relationships that could be construed as a potential conflict of interest.
Figures
Similar articles
-
Sensillum-specific, topographic projection patterns of olfactory receptor neurons in the antennal lobe of the cockroach Periplaneta americana.J Comp Neurol. 2012 Jun 1;520(8):1687-701. doi: 10.1002/cne.23007. J Comp Neurol. 2012. PMID: 22121009
-
Independent processing of increments and decrements in odorant concentration by ON and OFF olfactory receptor neurons.J Comp Physiol A Neuroethol Sens Neural Behav Physiol. 2018 Nov;204(11):873-891. doi: 10.1007/s00359-018-1289-6. Epub 2018 Sep 24. J Comp Physiol A Neuroethol Sens Neural Behav Physiol. 2018. PMID: 30251036 Free PMC article. Review.
-
The Rate of Concentration Change and How It Determines the Resolving Power of Olfactory Receptor Neurons.Front Physiol. 2016 Dec 27;7:645. doi: 10.3389/fphys.2016.00645. eCollection 2016. Front Physiol. 2016. PMID: 28082912 Free PMC article.
-
Encoding of Slowly Fluctuating Concentration Changes by Cockroach Olfactory Receptor Neurons Is Invariant to Air Flow Velocity.Front Physiol. 2019 Aug 7;10:943. doi: 10.3389/fphys.2019.00943. eCollection 2019. Front Physiol. 2019. PMID: 31440165 Free PMC article.
-
Odor Coding in Insects.In: Menini A, editor. The Neurobiology of Olfaction. Boca Raton (FL): CRC Press/Taylor & Francis; 2010. Chapter 2. In: Menini A, editor. The Neurobiology of Olfaction. Boca Raton (FL): CRC Press/Taylor & Francis; 2010. Chapter 2. PMID: 21882428 Free Books & Documents. Review.
Cited by
-
Multielectrode recordings of cockroach antennal lobe neurons in response to temporal dynamics of odor concentrations.J Comp Physiol A Neuroethol Sens Neural Behav Physiol. 2023 May;209(3):411-436. doi: 10.1007/s00359-022-01605-7. Epub 2023 Jan 16. J Comp Physiol A Neuroethol Sens Neural Behav Physiol. 2023. PMID: 36645471 Free PMC article.
-
Gain control in olfactory receptor neurons and the detection of temporal fluctuations in odor concentration.Front Physiol. 2023 Jul 12;14:1158855. doi: 10.3389/fphys.2023.1158855. eCollection 2023. Front Physiol. 2023. PMID: 37501922 Free PMC article.
-
Male sea lamprey countersignal relative to their baseline pheromone but not the intensity of rivals' signals.Biol Lett. 2025 Jul;21(7):20250108. doi: 10.1098/rsbl.2025.0108. Epub 2025 Jul 9. Biol Lett. 2025. PMID: 40628300 Free PMC article.
References
-
- Altner H., Loftus R., Schaller-Selzer L., Tichy H. (1983). Modality-specificity in insect sensilla and multimodal input from body appendages. Fort. Zool. 28 17–31.
-
- Atema J. (1985). Chemoreception in the sea: adaptations of chemoreceptors and behaviour to aquatic stimulus conditions. Symp. Soc. Exp. Biol. 39 387–423. - PubMed
-
- Atema J. (1995). “Chemical signals in the marine environment: dispersal, detection, and tem-poral signal analysis,” in Chemical Ecology: The Chemistry of Biotic Interaction, eds Eisner T., Eisner M. (Washington, DC: National Academic Press; ), 147–159.
Grants and funding
LinkOut - more resources
Full Text Sources