

Large-Scale Desynchronization During Interictal Epileptic Discharges Recorded With Intracranial EEG
- PMID: 33424733
- PMCID: PMC7785800
- DOI: 10.3389/fneur.2020.529460
Large-Scale Desynchronization During Interictal Epileptic Discharges Recorded With Intracranial EEG
Abstract
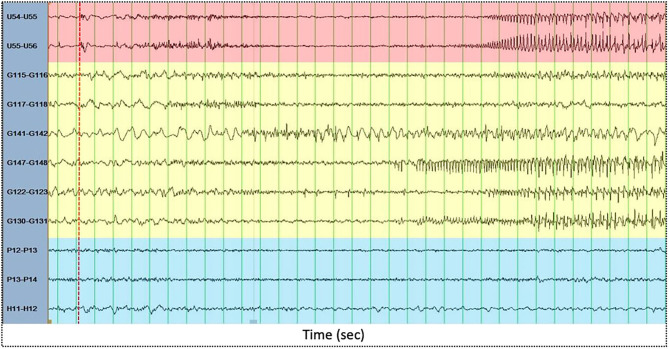
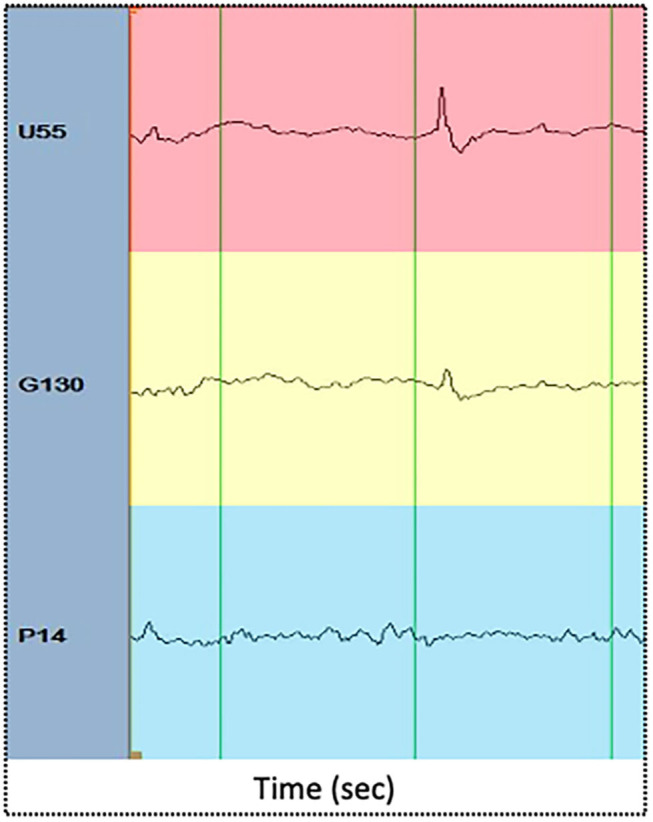
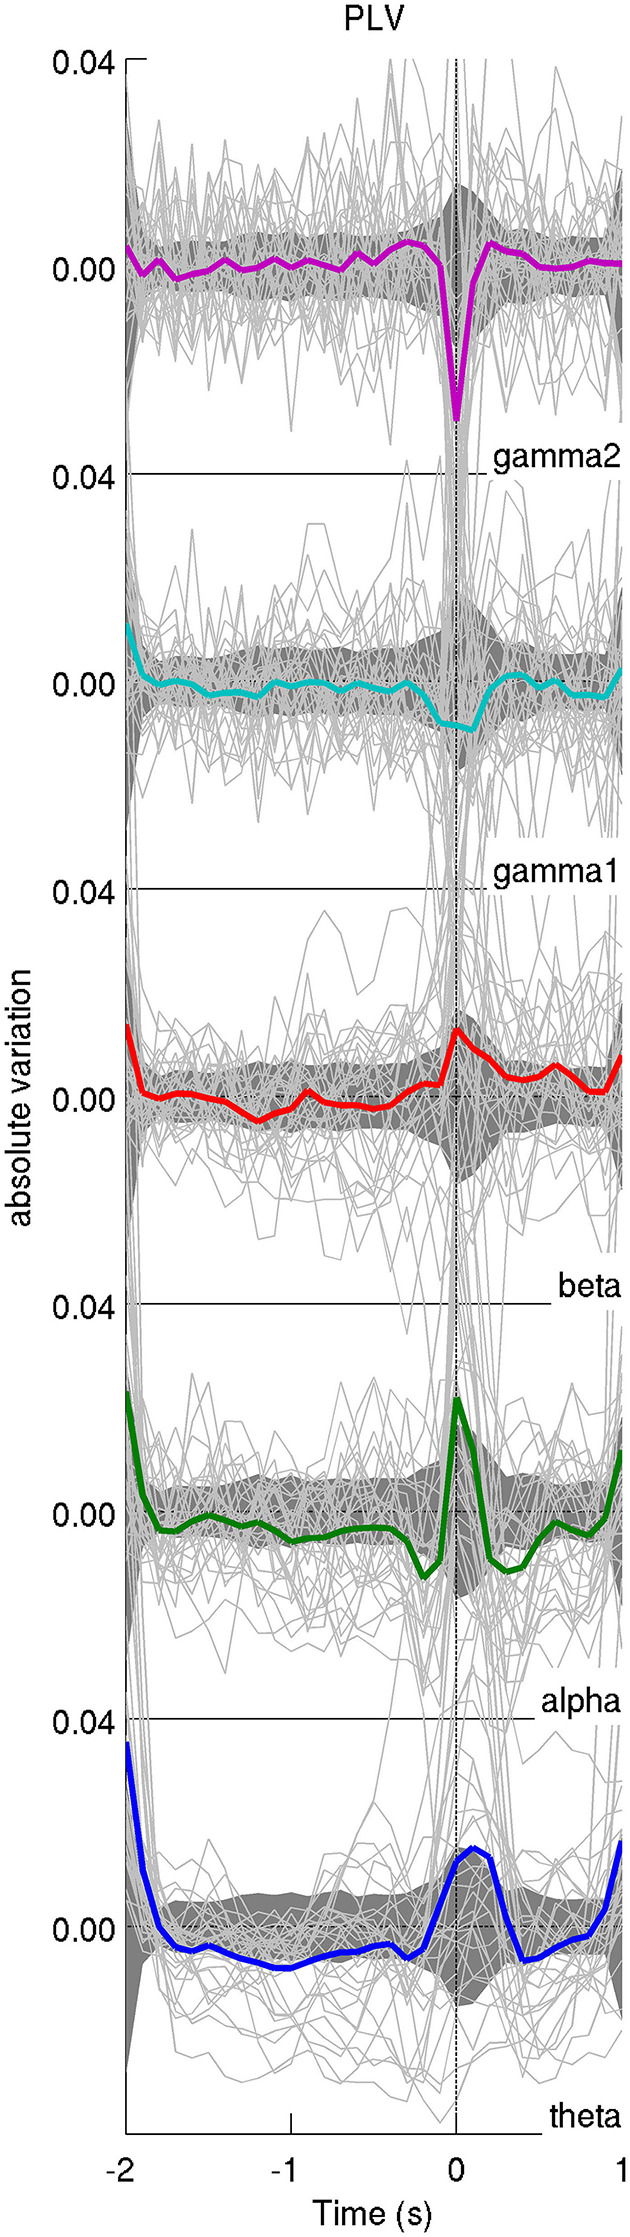
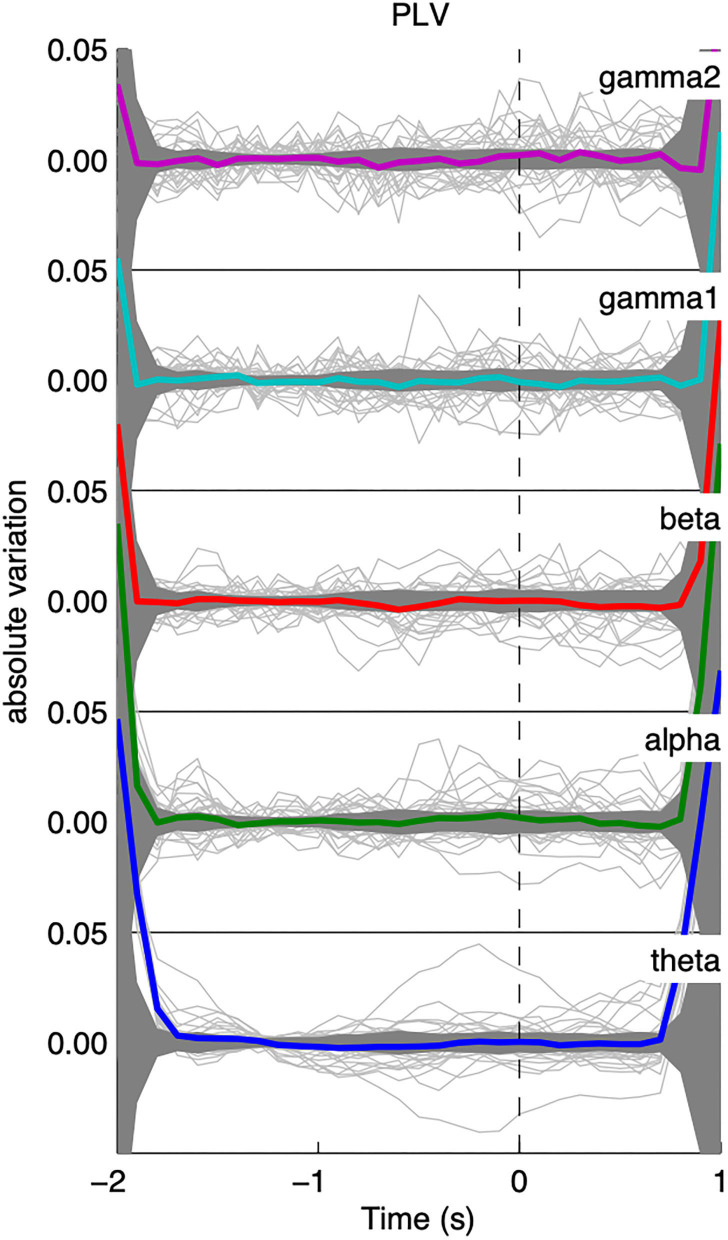
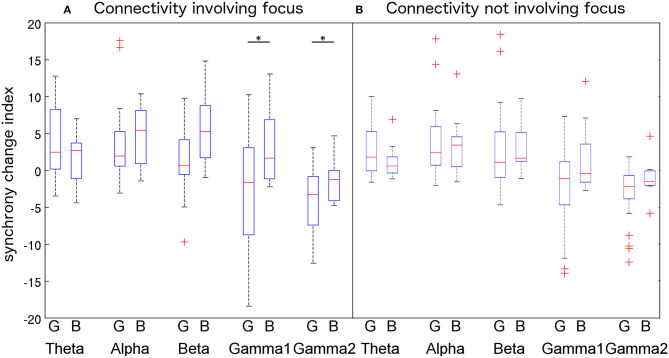
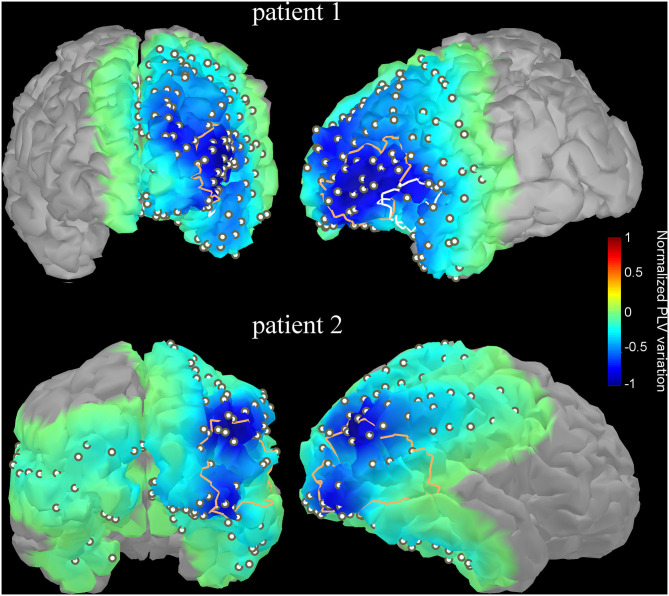
It is increasingly recognized that deep understanding of epileptic seizures requires both localizing and characterizing the functional network of the region where they are initiated, i. e., the epileptic focus. Previous investigations of the epileptogenic focus' functional connectivity have yielded contrasting results, reporting both pathological increases and decreases during resting periods and seizures. In this study, we shifted paradigm to investigate the time course of connectivity in relation to interictal epileptiform discharges. We recruited 35 epileptic patients undergoing intracranial EEG (iEEG) investigation as part of their presurgical evaluation. For each patient, 50 interictal epileptic discharges (IEDs) were marked and iEEG signals were epoched around those markers. Signals were narrow-band filtered and time resolved phase-locking values were computed to track the dynamics of functional connectivity during IEDs. Results show that IEDs are associated with a transient decrease in global functional connectivity, time-locked to the peak of the discharge and specific to the high range of the gamma frequency band. Disruption of the long-range connectivity between the epileptic focus and other brain areas might be an important process for the generation of epileptic activity. Transient desynchronization could be a potential biomarker of the epileptogenic focus since 1) the functional connectivity involving the focus decreases significantly more than the connectivity outside the focus and 2) patients with good surgical outcome appear to have a significantly more disconnected focus than patients with bad outcomes.
Keywords: epilepsy surgery; epileptic focus; epileptiform discharges; functional connectivity; intracranial electroencephalography; surgical outcome.
Copyright © 2020 Bou Assi, Zerouali, Robert, Lesage, Pouliot and Nguyen.
Conflict of interest statement
The authors declare that the research was conducted in the absence of any commercial or financial relationships that could be construed as a potential conflict of interest.
Figures
Similar articles
-
It's All About the Networks.Epilepsy Curr. 2019 May-Jun;19(3):165-167. doi: 10.1177/1535759719843301. Epub 2019 Apr 29. Epilepsy Curr. 2019. PMID: 31032667 Free PMC article.
-
Signal processing and computational modeling for interpretation of SEEG-recorded interictal epileptiform discharges in epileptogenic and non-epileptogenic zones.J Neural Eng. 2022 Sep 19;19(5). doi: 10.1088/1741-2552/ac8fb4. J Neural Eng. 2022. PMID: 36067727
-
Cognitive Processing Impacts High Frequency Intracranial EEG Activity of Human Hippocampus in Patients With Pharmacoresistant Focal Epilepsy.Front Neurol. 2020 Oct 27;11:578571. doi: 10.3389/fneur.2020.578571. eCollection 2020. Front Neurol. 2020. PMID: 33193030 Free PMC article.
-
Presurgical Evaluation of Epilepsy Using Resting-State MEG Functional Connectivity.Front Hum Neurosci. 2021 Jul 2;15:649074. doi: 10.3389/fnhum.2021.649074. eCollection 2021. Front Hum Neurosci. 2021. PMID: 34276321 Free PMC article. Review.
-
A review of signal processing and machine learning techniques for interictal epileptiform discharge detection.Comput Biol Med. 2024 Jan;168:107782. doi: 10.1016/j.compbiomed.2023.107782. Epub 2023 Nov 30. Comput Biol Med. 2024. PMID: 38070202 Review.
Cited by
-
Interictal epileptiform discharges in Alzheimer's disease: prevalence, relevance, and controversies.Front Neurol. 2023 Sep 21;14:1261136. doi: 10.3389/fneur.2023.1261136. eCollection 2023. Front Neurol. 2023. PMID: 37808503 Free PMC article. Review.
-
Epilepsy and sleep characteristics are associated with diminished 24-h memory retention in older adults with epilepsy.Epilepsia. 2023 Oct;64(10):2771-2780. doi: 10.1111/epi.17707. Epub 2023 Jul 10. Epilepsia. 2023. PMID: 37392445 Free PMC article.
-
Interictal Functional Connectivity in Focal Refractory Epilepsies Investigated by Intracranial EEG.Brain Connect. 2022 Dec;12(10):850-869. doi: 10.1089/brain.2021.0190. Epub 2022 Sep 14. Brain Connect. 2022. PMID: 35972755 Free PMC article. Review.
-
Preictal connectivity dynamics: Exploring inflow and outflow in iEEG networks.Front Netw Physiol. 2025 Apr 28;5:1539682. doi: 10.3389/fnetp.2025.1539682. eCollection 2025. Front Netw Physiol. 2025. PMID: 40357443 Free PMC article.
-
The network is more important than the node: stereo-EEG evidence of neurocognitive networks in epilepsy.Front Netw Physiol. 2024 Jul 24;4:1424004. doi: 10.3389/fnetp.2024.1424004. eCollection 2024. Front Netw Physiol. 2024. PMID: 39114571 Free PMC article.
References
-
- Geschwind N. Anatomical and functional specialization of the cerebral hemispheres in the human. Bull Mem Acad R Med Belg. (1979)134:286–97. - PubMed
LinkOut - more resources
Full Text Sources
Research Materials