. 2020 Dec 22:11:568805.
doi: 10.3389/fmicb.2020.568805. eCollection 2020.

Single-Cell Transcriptomics Reveals That Metabolites Produced by Paenibacillus bovis sp. nov. BD3526 Ameliorate Type 2 Diabetes in GK Rats by Downregulating the Inflammatory Response

Affiliations

Single-Cell Transcriptomics Reveals That Metabolites Produced by Paenibacillus bovis sp. nov. BD3526 Ameliorate Type 2 Diabetes in GK Rats by Downregulating the Inflammatory Response

Zhenyi Qiao et al. Front Microbiol. .

Abstract

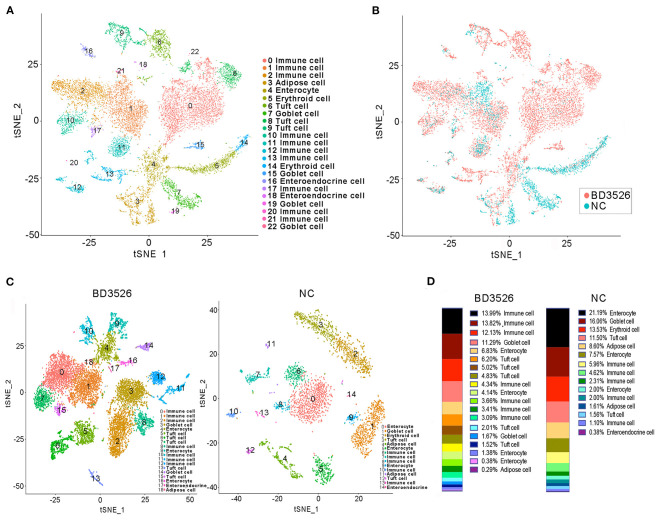
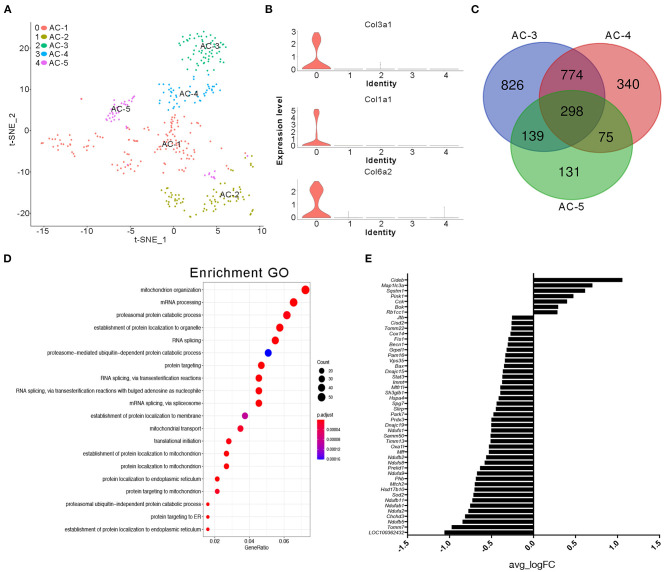
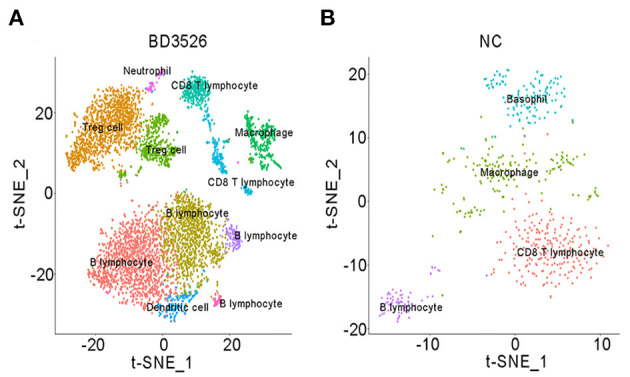
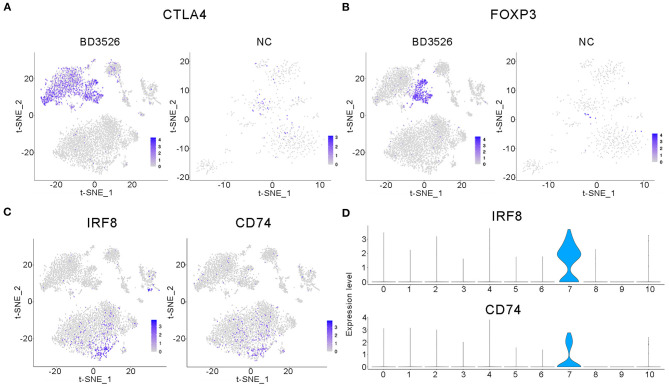
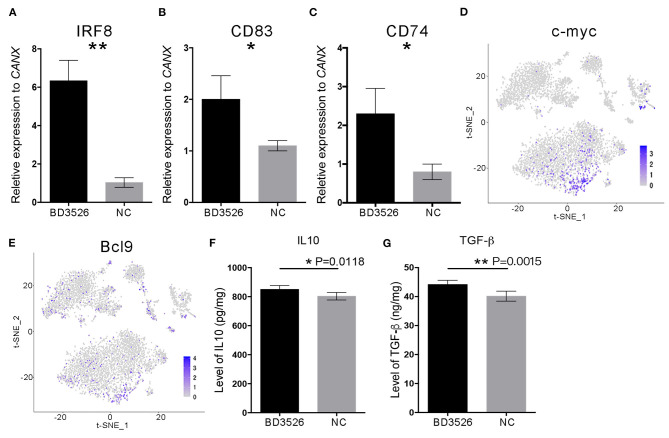
Chronic low-grade inflammation is widely involved in the development and progression of metabolic syndrome, which can lead to type 2 diabetes mellitus (T2DM). Dysregulation of proinflammatory and anti-inflammatory cytokines not only impairs insulin secretion by pancreatic β-cells but also results in systemic complications in late diabetes. In our previous work, metabolites produced by Paenibacillus bovis sp. nov. BD3526, which were isolated from Tibetan yak milk, demonstrated antidiabetic effects in Goto-Kakizaki (GK) rats. In this work, we used single-cell RNA sequencing (scRNA-seq) to further explore the impact of BD3526 metabolites on the intestinal cell composition of GK rats. Oral administration of the metabolites significantly reduced the number of adipocytes in the colon tissue of GK rats. In addition, cluster analysis of immune cells confirmed that the metabolites reduced the expression of interleukin (IL)-1β in macrophages in the colon and increased the numbers of dendritic cells (DCs) and regulatory T (Treg) cells. Further mechanistic studies of DCs confirmed that activation of the WNT/β-catenin pathway in DCs promoted the expression of IL-10 and transforming growth factor (TGF)-β, thereby increasing the number of Treg cells.

Keywords: Paenibacillus bovis sp. nov. BD3526; immune regulation; intestinal barrier; single-cell transcriptome sequencing; type 2 diabetes.


Conflict of interest statement

ZQ, JH, XW, HZ, HF, and ZW are employed by Bright Dairy and Food Co.

Figures

Figure 1
Figure 1
Regulatory effects of the metabolites on gene expression in Caco-2 cells in vitro. (A) Scatter plots of differentially expressed genes. Red indicates genes that showed increased expression in Caco-2 cells treated with the metabolites. Blue indicates genes that showed decreased expression in Caco-2 cells treated with the metabolites. (B) Heat map showing the differentially expressed genes. (C) Functional clustering of differentially expressed genes by Gene Ontology (GO). (D) KEGG was used to analyze the signal pathway clustering of the differentially expressed genes.
Figure 2
Figure 2
Observation of type 2 diabetes mellitus symptoms. (A) Goto–Kakizaki (GK) rats in the BD3526 and NC groups were tested for glucose tolerance. Blood glucose concentration was measured at 0, 15, 30, 60, and 120 min (n = 8, *P < 0.05, mean ± SEM). (B) Serum blood glucose was measured (*P < 0.05, mean ± SEM). (C) Serum insulin was measured (*P < 0.05, mean ± SEM). (D) Statistical analysis of the insulin resistance index (**P < 0.01, mean ± SEM). (E) Changes in the expression of the occludin (OCLN) gene were detected by qPCR (*P < 0.05, mean ± SEM). (F) Changes in the expression of the OCLN were detected by Western Blot.
Figure 3
Figure 3
t-SNE clustering analysis of the single-cell RNA sequencing (scRNA-seq) experiment. (A) t-SNE clustering of all cells in the BD3526 and NC groups after integration. Each color represents a different subidentity of cells. (B) Specific distribution of cells in the BD3526 and NC groups in t-SNE clustering. Red indicates cells from the BD3526 group, and cyan indicates cells from the NC group. (C) t-SNE cluster analysis was performed separately in the BD3526 and NC groups. Each color represents a different subidentity of cells. (D) Proportions of cells with different subidentities in the BD3526 and NC groups.
Figure 4
Figure 4
Cluster analysis of adipocytes in the NC group. (A) t-SNE clustering analysis of adipocytes in the NC group. Each color represents a different subidentity of cells. (B) Violin plots of the expression density of Col3a1, Col1a1, and Col6a2 in adipocytes. (C) Specific marker genes for AC-3, AC-4, and AC-5 cell subidentities. (D) Gene Ontology (GO) functional clustering of genes specifically expressed in AC-3 cells. (E) Expression of mitochondrial genes in AC-3 cells.
Figure 5
Figure 5
t-SNE clustering analysis of immune cells in the BD3526 and NC groups. (A,B) t-SNE clustering analysis of immune cells in the BD3526 group and the NC group, respectively. Each color represents a different subidentity of cells.
Figure 6
Figure 6
Characteristic analysis of immune cells in the BD3526 group. (A,B) Analyses of the expression and distribution of CTLA4 and FOXP3 genes in regulatory T (Treg) cells in the BD3526 group and the NC group, respectively, using the t-SNE diagram. (C,D) The expression distribution of IRF8 and CD74 genes in dendritic cells (DCs) in the BD3526 and NC groups, respectively, using t-SNE figures and violin plots.
Figure 7
Figure 7
The WNT/β-catenin signaling pathway in dendritic cells (DCs) was activated by BD3526 metabolites. The expression levels of IRF8, CD83, and CD74 (shown in A–C, respectively) in the BD3526 group and the NC group were analyzed using qRT-PCR (**P < 0.01, *P < 0.05, mean ± SEM). (D,E) The expression and distribution of c-myc and BCL9, respectively, in DCs. (F) Quantitative analysis of the anti-inflammatory factor interleukin (IL)-10 in the BD3526 and NC groups (*P < 0.05, mean ± SEM). (G) Quantitative analysis of the chemokine transforming growth factor (TGF)-β in the BD3526 and NC groups (**P < 0.01, mean ± SEM).

Similar articles

Cited by

References

    1. Boni-Schnetzler M., Jeffrey T., Geraldine P., Lorella M., Ehses J. A., Julie K. C., et al. . (2008). Increased interleukin (IL)-1β messenger ribonucleic acid expression in β-cells of individuals with type 2 diabetes and regulation of IL-1β in human islets by glucose and autostimulation. J. Clin. Endocrinol. Metab. 93, 4065–4074. 10.1210/jc.2008-0396 - DOI - PMC - PubMed
    1. Coughlin S. S., Calle E. E., Teras L. R., Jennifer P., Thun M. J. (2004). Diabetes mellitus as a predictor of cancer mortality in a large cohort of US adults. Am. J. Epidemiol. 159, 1160–1167. 10.1093/aje/kwh161 - DOI - PubMed
    1. Denning T. L., Wang Y. C., Patel S. R., Williams I. R., Pulendran B. (2007). Lamina propria macrophages and dendritic cells differentially induce regulatory and interleukin 17–producing T cell responses. Nat. Immunol. 8, 1086–1094. 10.1038/ni1511 - DOI - PubMed
    1. Donath M. Y., Dinarello C. A., Mandruppoulsen T. (2019). Targeting innate immune mediators in type 1 and type 2 diabetes. Nat. Rev. Immunol. 19, 734–746. 10.1038/s41577-019-0213-9 - DOI - PubMed
    1. Donath M. Y., Shoelson S. E. (2011). Type 2 diabetes as an inflammatory disease. Nat. Rev. Immunol. 11, 98–107. 10.1038/nri2925 - DOI - PubMed

LinkOut - more resources