. 2020 Dec 3:11:600622.
doi: 10.3389/fmicb.2020.600622. eCollection 2020.

Anti-quorum Sensing and Protective Efficacies of Naringin Against Aeromonas hydrophila Infection in Danio rerio

Affiliations

Anti-quorum Sensing and Protective Efficacies of Naringin Against Aeromonas hydrophila Infection in Danio rerio

Ramanathan Srinivasan et al. Front Microbiol. .

Abstract

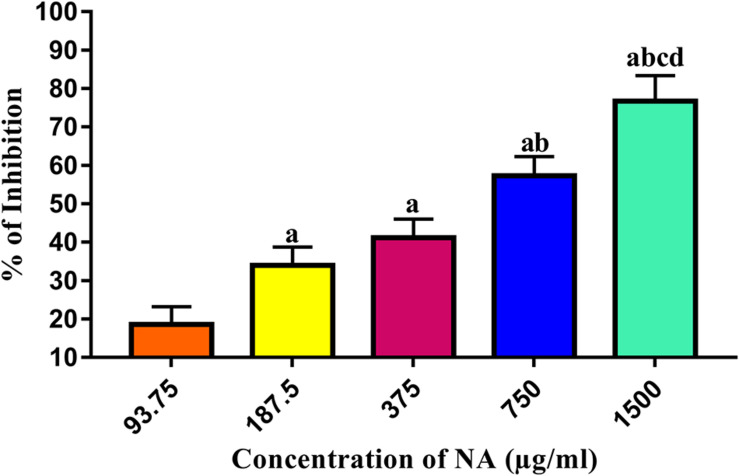
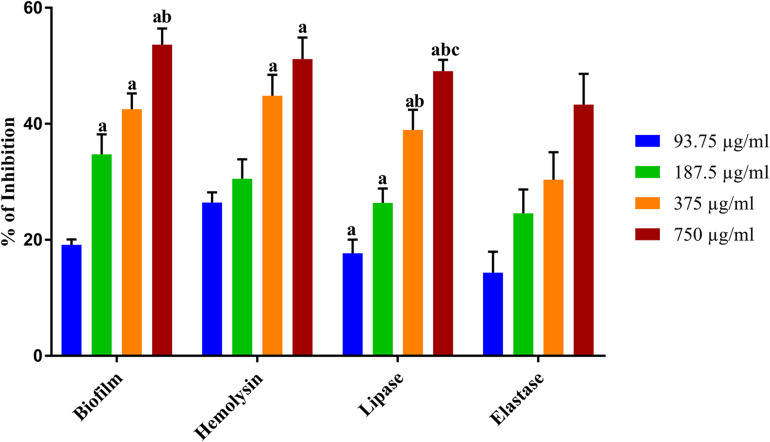
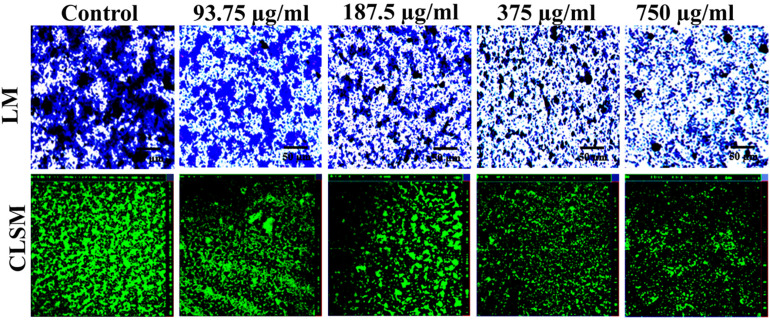
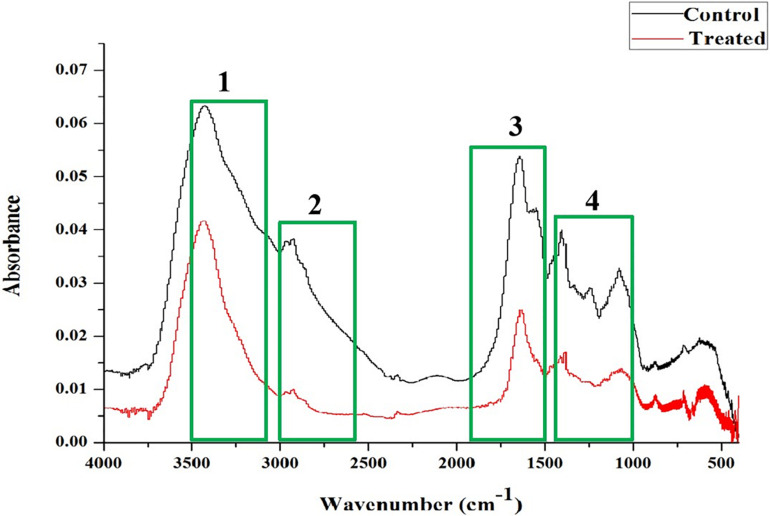
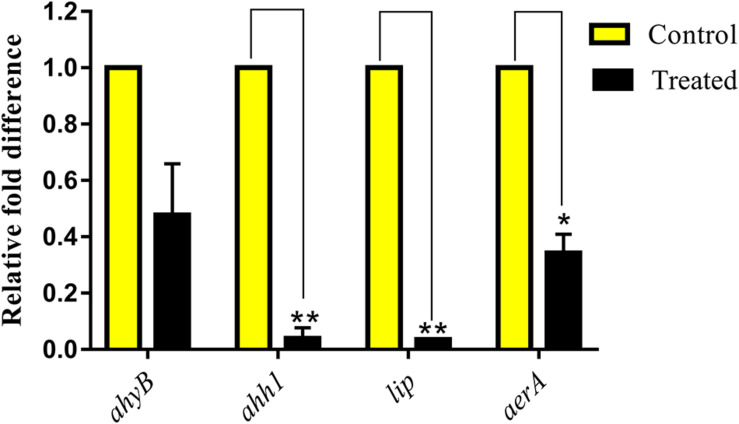
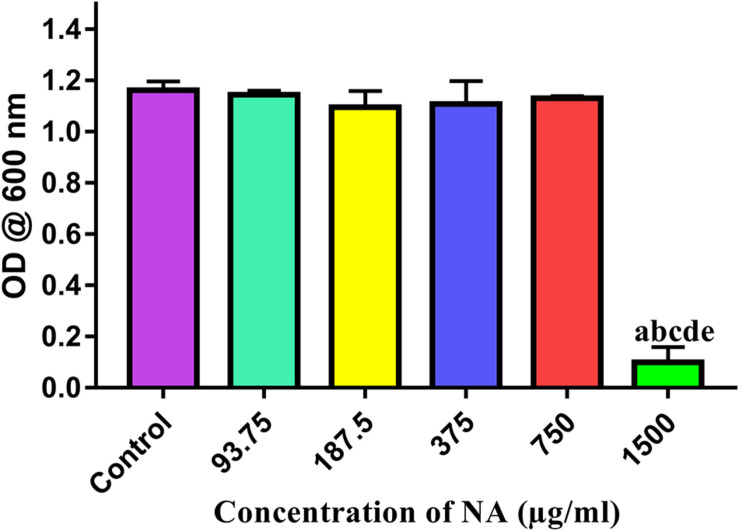
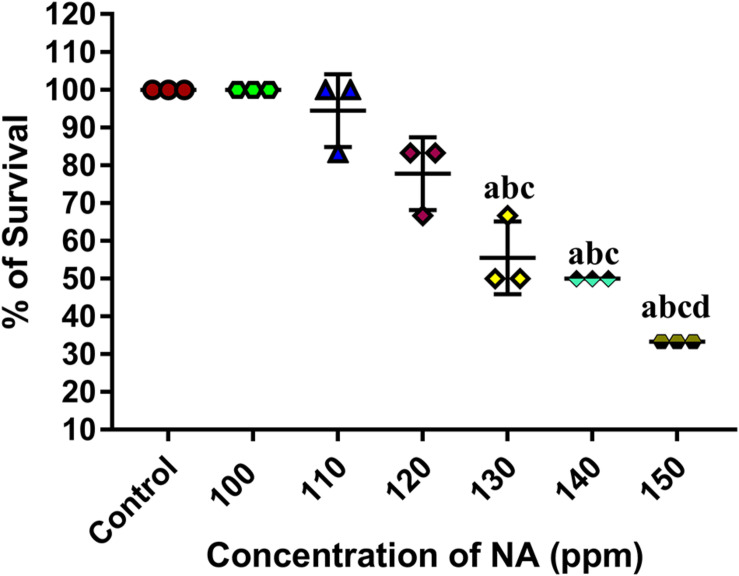
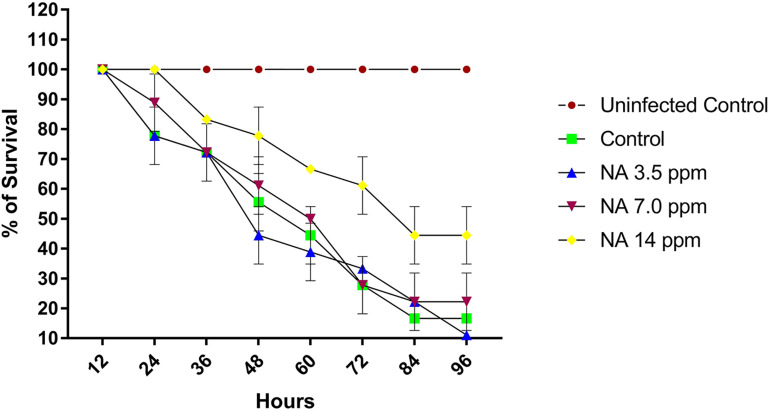
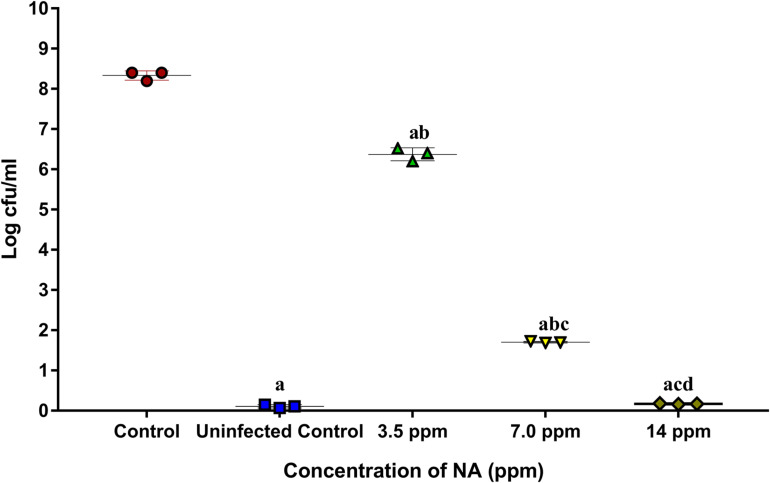
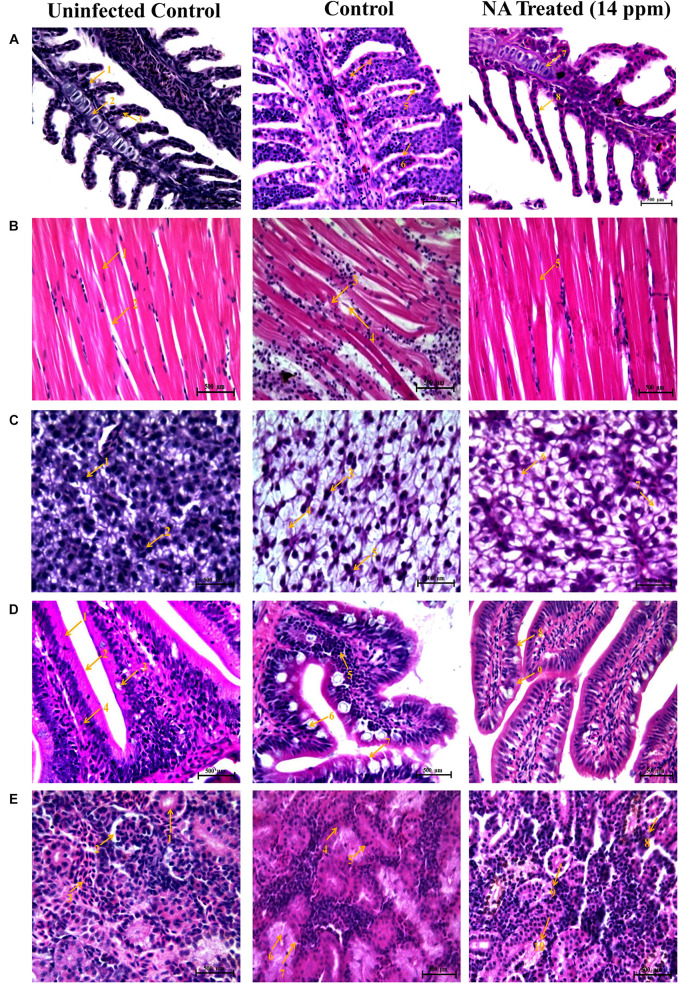
It is now well known that the quorum sensing (QS) mechanism coordinates the production of several virulence factors and biofilm formation in most pathogenic microorganisms. Aeromonas hydrophila is a prime pathogen responsible for frequent outbreaks in aquaculture settings. Recent studies have also continuously reported that A. hydrophila regulates virulence factor production and biofilm formation through the QS system. In addition to the presence of antibiotic resistance genes, biofilm-mediated antibiotic resistance increases the severity of A. hydrophila infections. To control the bacterial pathogenesis and subsequent infections, targeting the QS mechanism has become one of the best alternative methods. Though very few compounds were identified as QS inhibitors against A. hydrophila, to date, the screening and identification of new and effective natural QS inhibitors is a dire necessity to control the infectious A. hydrophila. The present study endorses naringin (NA) as an anti-QS and anti-infective agent against A. hydrophila. Initially, the NA showed a concentration-dependent biofilm reduction against A. hydrophila. Furthermore, the results of microscopic analyses and quantitative virulence assays displayed the promise of NA as a potential anti-QS agent. Subsequently, the downregulation of ahh1, aerA, lip and ahyB validate the interference of NA in virulence gene expression. Furthermore, the in vivo assays were carried out in zebrafish model system to evaluate the anti-infective potential of NA. The outcome of the immersion challenge assay showed that the recovery rate of the zebrafish has substantially increased upon treatment with NA. Furthermore, the quantification of the bacterial load upon NA treatment showed a decreased level of bacterial counts in zebrafish when compared to the untreated control. Moreover, the NA treatment averts the pathogen-induced histoarchitecture damages in vital organs of zebrafish, compared to their respective controls. The current study has thus analyzed the anti-QS and anti-infective capabilities of NA and could be employed to formulate effective treatment measures against A. hydrophila infections.

Keywords: Aeromonas hydrophila; biofilm; naringin; quorum sensing; virulence factors; zebrafish.


Conflict of interest statement

The authors declare that the research was conducted in the absence of any commercial or financial relationships that could be construed as a potential conflict of interest.

Figures

FIGURE 1
FIGURE 1
Determination of MBIC of NA against A. hydrophila biofilm formation. Results indicate the mean values of three independent experiments and SD. The Tukey’s multiple comparisons test (one-way analysis of variance) was used to compare the groups. ap ≤ 0.0001 when compare to control, bp ≤ 0.0001 when compare to 93.75 μg/ml, cp ≤ 0.0001 when compare to 187.5 μg/ml, and dp ≤ 0.0001 when compare to 375 μg/ml.
FIGURE 2
FIGURE 2
Inhibitory effect of NA on the QS controlled virulence factors production. The graph illustrates percentages of biofilm, hemolysin, lipase, and elastase inhibition in A. hydrophila upon treatment with NA at different concentrations (93.75–750 μg/ml). Results indicate the mean values of three independent experiments and SD. The Tukey’s multiple comparisons test (one-way analysis of variance) was used to compare the groups. ap ≤ 0.0001 when compare to control, bp ≤ 0.0001 when compare to 93.75 μg/ml, and cp ≤ 0.0001 when compared to 187.5 μg/ml.
FIGURE 3
FIGURE 3
Microscopic validation on the biofilm inhibitory effect of NA against A. hydrophila. The light microscopic (LM) and confocal laser scanning microscopic (CLSM) images of A. hydrophila biofilm formed in the presence (93.75–750 μg/ml) and the absence (control) of NA.
FIGURE 4
FIGURE 4
FT-IR spectral analysis showed variation in the absorbance in A. hydrophila cells upon treatment with NA (750 μg/ml) compared to the untreated control cells. The regions taken for analysis were shown in the following boxes: (1) 3,500–3,100 cm–1 and hydration of microbial cells; (2) 3,000–2,750 cm–1 related to fatty acids; (3) 1,800–1,500 cm–1: amide linkages within proteins and peptides; and (4) 1,500–1,000 cm–1 of a mixed region among proteins and fatty acids of microbial cells.
FIGURE 5
FIGURE 5
Effect of NA at MBIC on the relative expression of virulence genes in A. hydrophila. NA treatment (750 μg/ml) downregulated the QS-controlled virulence genes expression in A. hydrophila. Results indicate the mean values of three independent experiments and SD. The Student’s t-test was used to compare the control and treated data from qRT-PCR analysis. *p ≤ 0.0308 and **p ≤ 0.0033.
FIGURE 6
FIGURE 6
Effect of different concentrations of NA (93.75–1,500 μg/ml) on the growth of A. hydrophila. Results indicate the mean values of three independent experiments and SD. The Tukey’s multiple comparisons test (one-way analysis of variance) was used to compare the groups. ap ≤ 0.0001 when compare to control, bp ≤ 0.0001 when compare to 93.75 μg/ml, cp ≤ 0.0001 when compare to 187.5 μg/ml, dp ≤ 0.0001 when compare to 375 μg/ml, and ep ≤ 0.0001 when compare to 750 μg/ml.
FIGURE 7
FIGURE 7
Determination of LC50 value of NA on zebrafish. Results indicate the mean values of three independent experiments and SD. The Tukey’s multiple comparisons test (one-way analysis of variance) was used to compare the groups. ap ≤ 0.0001 when compare to control, bp ≤ 0.0001 when compare to 100 ppm, cp ≤ 0.0001 when compare to 110 ppm, and dp ≤ 0.0001 when compare to 120 ppm.
FIGURE 8
FIGURE 8
The graph represents the survival percentage of post challenged zebrafishes upon treatment with and without NA at different sub-lethal concentrations (3.5, 7.0, and 14 ppm). Results indicate the mean values of three independent experiments and SD.
FIGURE 9
FIGURE 9
The graph represents CFU counts of A. hydrophila in post challenged zebrafish upon treatment with (3.5, 7.0, and 14 ppm) and without NA. Results indicate the mean values of three independent experiments and SD. The Tukey’s multiple comparisons test (one-way analysis of variance) was used to compare the groups. ap ≤ 0.0001 when compare to control, bp ≤ 0.0001 when compare to uninfected control, cp ≤ 0.0001 when compare to 3.5 ppm, and dp ≤ 0.0001 when compare to 7.0 ppm.
FIGURE 10
FIGURE 10
Histopathology analysis of gills (A). 1. Branchial blood vessels; 2. Primary lamella; 3. Secondary lamella; 4. Fusion of secondary lamella; 5. Lamellar lifting; 6. Proliferation of filamentary epithelium; 7. Normal branchial blood vessels; 8. Rescued & healthy secondary lamellae. Histopathology analysis of muscle (B). 1. Muscle bundles; 2. Muscle fiber; 3. Degeneration of muscle bundles; 4. Swelling of muscle fiber; 5. Healthy muscle bundles. Histopathology analysis of liver (C). 1. Hepatocytes; 2. Spherical nucleus; 3. Fatty acid changes in hepatocytes; 4. Cytoplasmic vacuolation; 5. Hepatocytes disruption; 6. Rescued and healthy hepatocytes; 7. Small cytoplasmic vacuolation. Histopathology analysis of intestine (D). 1. Tunica mucosa; 2. External muscle layer; 3. Goblet cell; 4. Lymphocytes; 5. Degeneration of epithelial cells; 6. Hyperplasia of goblet cells; 7. Collapsed tunica mucosa; 8. Normal goblet cell; 9. Rescued and healthy tunica mucosa. Histopathology analysis of kidney (E). 1. Renal glomerulus; 2. Bowman’s space; 3. Normal distal tubules; 4. Congested distal tubules; 5. Hematopoietic necrosis; 6. Degeneration of renal glomerulus; 7. Reduced bowman’s space; 8. Normal bowman’s space; 9. Normal renal glomerulus; 10. Rescued and healthy distal tubulus.

Similar articles

Cited by

References

    1. Afifi S., Al-Thobiati S., Hazaa M. (2000). Bacteriological and histopathological studies on Aeromonas hydrophila infection of Nile tilapia (Oreochromis niloticus) from fish farms in Saudi Arabia. Assiut Vet. Med. J. 42 195–205.
    1. Alexpandi R., Prasanth M. I., Ravi A. V., Balamurugan K., Durgadevi R., Srinivasan R., et al. (2019). Protective effect of neglected plant Diplocyclos palmatus on quorum sensing mediated infection of Serratia marcescens and UV-A induced photoaging in model Caenorhabditis elegans. J. Photochem. Photobiol. B Biol. 201:111637. 10.1016/j.jphotobiol.2019.111637 - DOI - PubMed
    1. Annapoorani A., Parameswari R., Pandian S. K., Ravi A. V. (2012). Methods to determine antipathogenic potential of phenolic and flavonoid compounds against urinary pathogen Serratia marcescens. J. Microbiol. Methods 91 208–211. 10.1016/j.mimet.2012.06.007 - DOI - PubMed
    1. Asao T., Kinoshita Y., Kozaki S., Uemura T., Sakaguchi G. (1984). Purification and some properties of Aeromonas hydrophila hemolysin. Infect. Immun. 46 122–127. 10.1128/iai.46.1.122-127.1984 - DOI - PMC - PubMed
    1. Bakkiyaraj D., Karutha Pandian S. T. (2010). In vitro and in vivo antibiofilm activity of a coral associated actinomycete against drug resistant Staphylococcus aureus biofilms. Biofouling 26 711–717. 10.1080/08927014.2010.511200 - DOI - PubMed

LinkOut - more resources