. 2020 Dec 23:11:600989.
doi: 10.3389/fmicb.2020.600989. eCollection 2020.

Imaging Mass Cytometric Analysis of Postmortem Tissues Reveals Dysregulated Immune Cell and Cytokine Responses in Multiple Organs of COVID-19 Patients

Affiliations

Imaging Mass Cytometric Analysis of Postmortem Tissues Reveals Dysregulated Immune Cell and Cytokine Responses in Multiple Organs of COVID-19 Patients

Chong Wang et al. Front Microbiol. .

Abstract

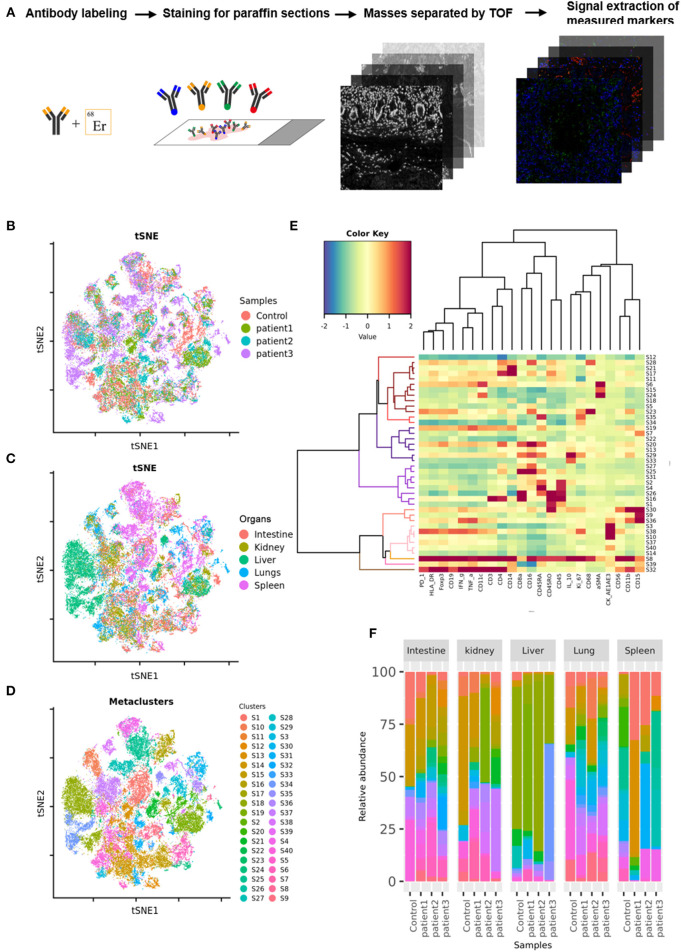
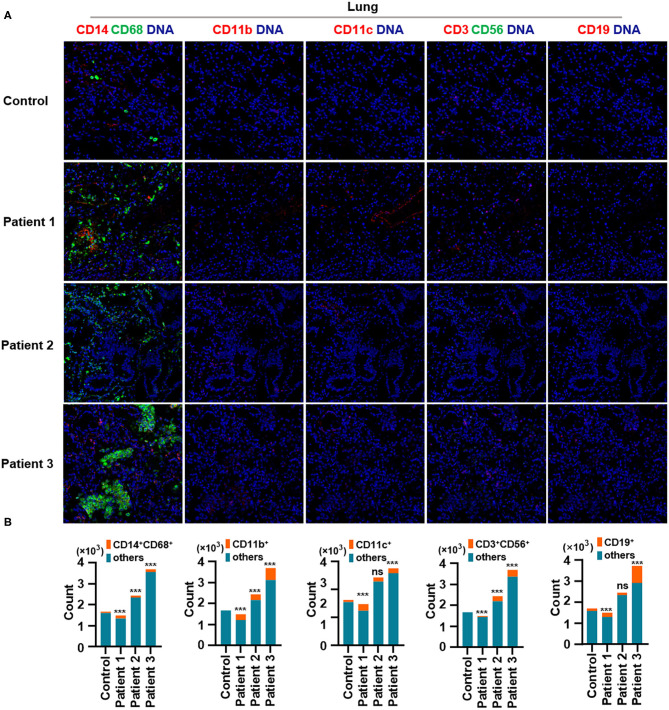
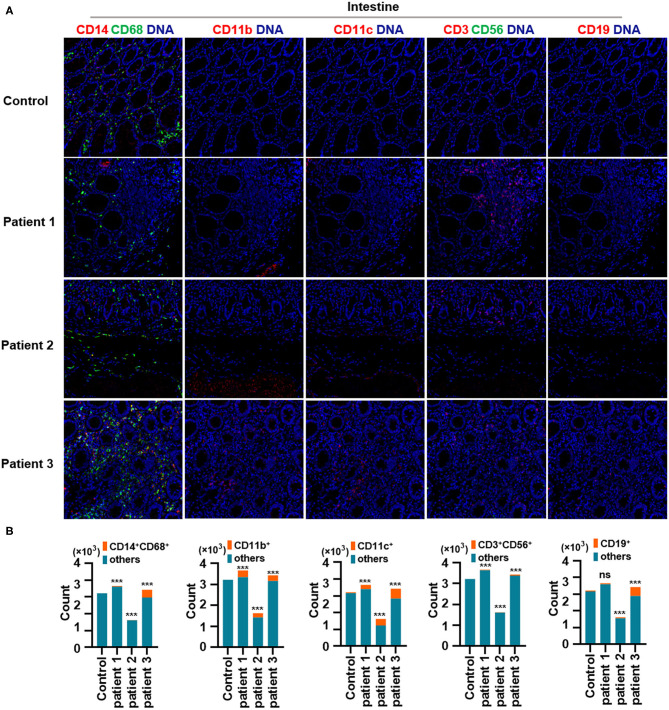
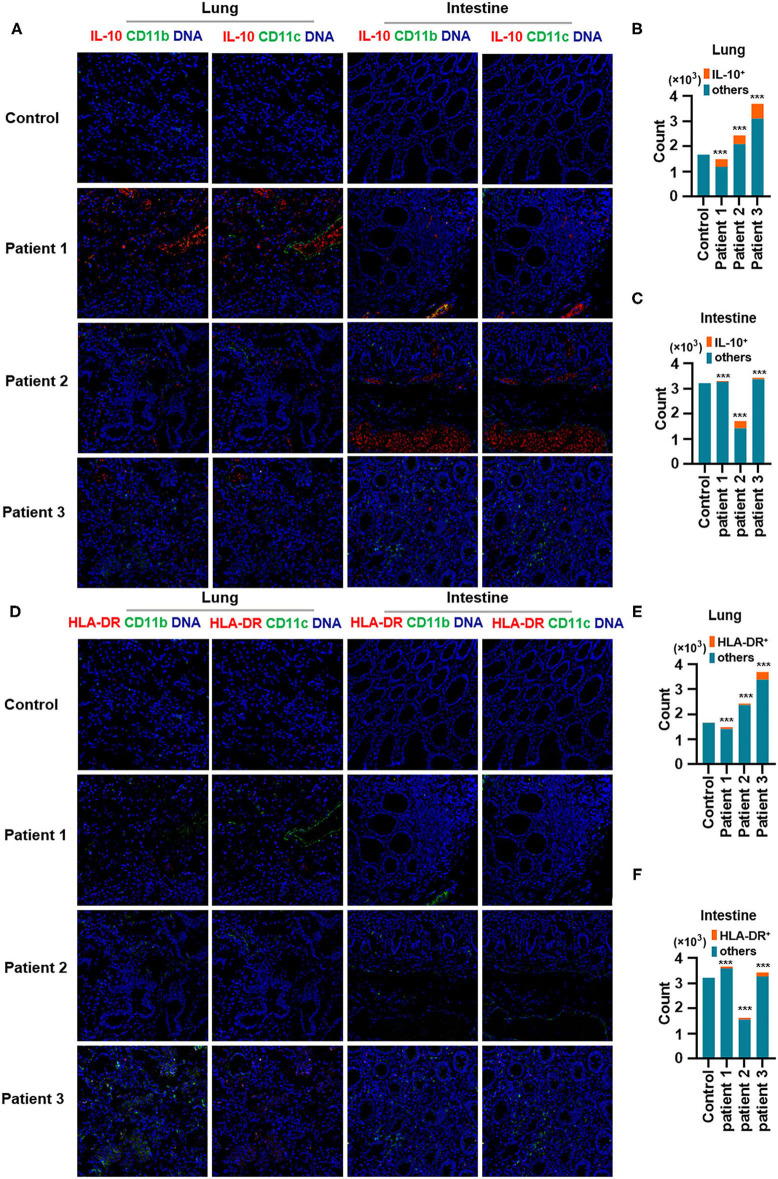
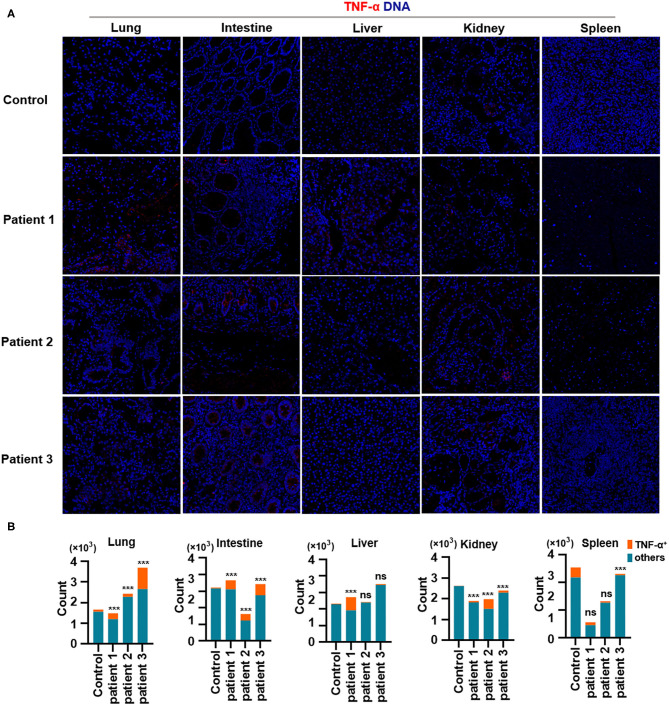
SARS-coronavirus-2-induced immune dysregulation and inflammatory responses are involved in the pathogenesis of coronavirus disease-2019 (COVID-19). However, very little is known about immune cell and cytokine alterations in specific organs of COVID-19 patients. Here, we evaluated immune cells and cytokines in postmortem tissues, i.e., lungs, intestine, liver, kidneys, and spleen of three patients with COVID-19. Imaging mass cytometry revealed monocyte, macrophage, and dendritic cell (DC) infiltration in the lung, intestine, kidney, and liver tissues. Moreover, in patients with COVID-19, natural killer T cells infiltrated the liver, lungs, and intestine, whereas B cells infiltrated the kidneys, lungs, and intestine. CD11b+ macrophages and CD11c+ DCs also infiltrated the lungs and intestine, a phenomenon that was accompanied by overproduction of the immunosuppressive cytokine interleukin (IL)-10. However, CD11b+ macrophages and CD11c+ DCs in the lungs or intestine of COVID-19 patients did not express human leukocyte antigen DR isotype. In contrast, tumor necrosis factor (TNF)-α expression was higher in the lungs, intestine, liver, and kidneys, but not in the spleen, of all COVID-19 patients (compared to levels in controls). Collectively, these findings suggested that IL-10 and TNF-α as immunosuppressive and pro-inflammatory agents, respectively,-might be prognostic and could serve as therapeutic targets for COVID-19.

Keywords: COVID-19; imaging mass cytometry (IMC); immune dysregulation; inflammatory response; organ specific response.


Conflict of interest statement

SW, YYang, YL, RY, and YYan were employed by company Gencode Diagnostics Inc., Beijing, China. The remaining authors declare that the research was conducted in the absence of any commercial or financial relationships that could be construed as a potential conflict of interest.

Figures

Figure 1
Figure 1
Imaging mass cytometry (IMC) of tissues from patients with coronavirus disease-2019 (COVID-19). (A) Schematic of IMC acquisition for multiplexed images from three patients with COVID-19 and controls. (B) t-SNE map displaying 55,391 subsampled single cells from each PhenoGraph cluster identified in heatmap images colored according to sample. (C) t-SNE map displaying 55,391 subsampled single cells from each PhenoGraph cluster identified in heatmap images colored according to organ. (D) t-SNE map displaying 55,391 subsampled single cells from each PhenoGraph cluster identified in heatmap images colored according to cluster. (E) Heatmap showing the z-scored mean marker expression of the panel markers for each PhenoGraph cluster. Clusters and markers are grouped according to expression profiles. (F) Bar plots showing the relative percent abundances of the cell clusters.
Figure 2
Figure 2
Immune cell responses to severe acute respiratory syndrome coronavirus 2 (SARS-CoV-2) in the lungs of patients with coronavirus disease-2019 (COVID-19). Representative imaging mass cytometry (IMC) for each panel, with different colors to distinguish panels; iridium-DNA staining is shown in blue. (A) Monocytes (CD14 and CD68), CD11b+ macrophages, CD11c+ dendritic cells (DCs), natural killer T (NKT) cells (CD3 and CD56), and B cells (CD19) in the lungs of controls and three patients with COVID-19. (B) Bar plot for the comparison of monocyte (CD14 and CD68), CD11b+ macrophage, CD11c+ DC, NKT cell (CD3 and CD56), and B cell (CD19) counts in the lungs of controls and three patients with COVID-19. The significance of differences between groups is shown in horizontal brackets and was assessed using Fisher's exact test. ***P < 0.01; ns, P > 0.01.
Figure 3
Figure 3
Immune cell responses to severe acute respiratory syndrome coronavirus 2 (SARS-CoV-2) in the intestine of patients with coronavirus disease-2019 (COVID-19). (A) Monocytes (CD14 and CD68), CD11b+ macrophages, CD11c+ dendritic cells (DCs), natural killer T (NKT) cells (CD3 and CD56), and B cells (CD19) in the intestine of controls and three patients with COVID-19. (B) Bar plot for the comparison of monocytes (CD14 and CD68), CD11b+ macrophages, CD11c+ DCs, NKT cells (CD3 and CD56), and B cells (CD19) in the intestine of controls and three patients with COVID-19. The significance of differences between groups is shown as horizontal brackets and was assessed using Fisher's exact test. ***P < 0.01; ns, P > 0.01.
Figure 4
Figure 4
Production of IL-10 and expression of human leukocyte antigen DR isotype (HLA-DR) in the lungs and intestines of patients with coronavirus disease-2019 (COVID-19). (A) Imaging mass cytometry (IMC) for IL-10, CD11b, and CD11c in the lungs and intestine of controls and patients with COVID-19. Iridium-DNA staining is shown in blue, IL-10 staining is shown in red, and CD11b and CD11c staining is shown in green. (B,C) Bar plot for the comparison of IL-10, CD11b, and CD11c in the lungs and intestine of controls and three patients with COVID-19. (D) IMC for HLA-DR, CD11b, and CD11c in the lungs and intestine of controls and patients with COVID-19. Iridium-DNA staining is shown in blue, HLA-DR staining is shown in red, and CD11b and CD11c staining is shown in green. (E,F) Bar plot for the comparison of HLA-DR in the lungs and intestine of controls and patients with COVID-19. The significance of differences between groups is shown as horizontal brackets and was assessed using Fisher's exact test. ***P < 0.01; ns, P > 0.01.
Figure 5
Figure 5
Production of TNF-α in tissues from patients with coronavirus disease-2019 (COVID-19). (A) Imaging mass cytometry (IMC) for TNF-α in the lungs, intestine, liver, kidneys, and spleen from controls or patients with COVID-19; iridium-DNA staining is shown in blue, and TNF-α staining is shown in red. (B) Bar plot for the comparison of TNF-α in the lungs and intestine of controls and three patients with COVID-19. The significance of differences between groups is shown as horizontal brackets and was assessed using Fisher's exact test. ***P < 0.01; ns, P > 0.01.

References

    1. Carpenter A. E., Jones T. R., Lamprecht M. R., Clarke C., Kang I. H., Friman O., et al. (2006). CellProfiler: image analysis software for identifying and quantifying cell phenotypes. Genome Biol. 7:R100 10.1186/gb-2006-7-10-r100 - DOI - PMC - PubMed
    1. Chen N., Zhou M., Dong X., Qu J., Gong F., Han Y., et al. (2020). Epidemiological and clinical characteristics of 99 cases of 2019 novel coronavirus pneumonia in Wuhan, China: a descriptive study. Lancet 395, 507–513. 10.1016/S0140-6736(20)30211-7 - DOI - PMC - PubMed
    1. De Felice F. G., Tovar-Moll F., Moll J., Munoz D. P., Ferreira S. T. (2020). Severe acute respiratory syndrome coronavirus 2 (SARS-CoV-2) and the central nervous system. Trends Neurosci. 43, 355–357. 10.1016/j.tins.2020.04.004 - DOI - PMC - PubMed
    1. de Waal Malefyt R., Abrams J., Bennett B., Figdor C. G., de Vries J. E. (1991). Interleukin 10(IL-10) inhibits cytokine synthesis by human monocytes: an autoregulatory role of IL-10 produced by monocytes. J. Exp. Med. 174, 1209–1220. 10.1084/jem.174.5.1209 - DOI - PMC - PubMed
    1. Fu Y., Cheng Y., Wu Y. (2020). Understanding SARS-CoV-2-mediated inflammatory responses: from mechanisms to potential therapeutic tools. Virol. Sin. 35, 266–271. 10.1007/s12250-020-00207-4 - DOI - PMC - PubMed