

Comparison of Two Sampling Techniques for Evaluating Ruminal Fermentation and Microbiota in the Planktonic Phase of Rumen Digesta in Dairy Cows
- PMID: 33424820
- PMCID: PMC7785721
- DOI: 10.3389/fmicb.2020.618032
Comparison of Two Sampling Techniques for Evaluating Ruminal Fermentation and Microbiota in the Planktonic Phase of Rumen Digesta in Dairy Cows
Abstract
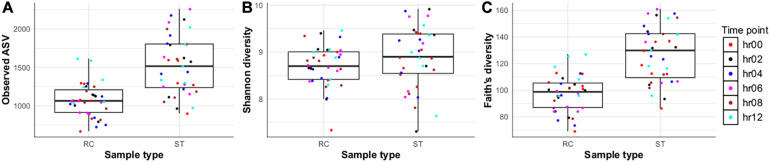
The objective of this experiment was to compare ruminal fluid samples collected through rumen cannula (RC) or using an oral stomach tube (ST) for measurement of ruminal fermentation and microbiota variables. Six ruminally cannulated lactating Holstein cows fed a standard diet were used in the study. Rumen samples were collected at 0, 2, 4, 6, 8, and 12 h after the morning feeding on two consecutive days using both RC and ST techniques. Samples were filtered through two layers of cheesecloth and the filtered ruminal fluid was used for further analysis. Compared with RC, ST samples had 7% greater pH; however, the pattern in pH change after feeding was similar between sampling methods. Total volatile fatty acids (VFA), acetate and propionate concentrations in ruminal fluid were on average 23% lower for ST compared with RC. There were no differences between RC and ST in VFA molar proportions (except for isobutyrate), ammonia and dissolved hydrogen (dH2) concentrations, or total protozoa counts, and there were no interactions between sampling technique and time of sampling. Bacterial ASV richness was higher in ST compared with RC samples; however, no differences were observed for Shannon diversity. Based on Permanova analysis, bacterial community composition was influenced by sampling method and there was an interaction between sampling method and time of sampling. A core microbiota comprised of Prevotella, S24-7, unclassified Bacteroidales and unclassified Clostridiales, Butyrivibrio, unclassified Lachnospiraceae, unclassified Ruminococcaceae, Ruminococcus, and Sharpea was present in both ST and RC samples, although their relative abundance varied and was influenced by an interaction between sampling time and sampling method. Overall, our results suggest that ruminal fluid samples collected using ST (at 180 to 200 cm depth) are not representative of rumen pH, absolute values of VFA concentrations, or bacterial communities >2 h post-feeding when compared to samples of ruminal fluid collected using RC. However, ST can be a feasible sampling technique if the purpose is to study molar proportions of VFA, protozoa counts, dH2, and ammonia concentrations.
Keywords: non-invasive sampling techniques; rumen cannula; rumen fermentation; rumen microbiome; stomach tube; stomach tube method.
Copyright © 2020 de Assis Lage, Räisänen, Melgar, Nedelkov, Chen, Oh, Fetter, Indugu, Bender, Vecchiarelli, Hennessy, Pitta and Hristov.
Conflict of interest statement
The authors declare that the research was conducted in the absence of any commercial or financial relationships that could be construed as a potential conflict of interest.
Figures


References
-
- Anderson M. J. (2001). A new method for non-parametric multivariate analysis of variance. Austral Ecol. 26 32–46. 10.1111/j.1442-9993.2001.01070.pp.x - DOI
-
- Bryant A. M. (1964). Variations in the pH and volatile fatty acid concentration within the bovine reticulo-rumen. N. Z. J. Agric. Res. 7 694–706. 10.1080/00288233.1964.10416398 - DOI
LinkOut - more resources
Full Text Sources