. 2020 Dec 23:11:564887.
doi: 10.3389/fimmu.2020.564887. eCollection 2020.

Physical Characterization of Colorectal Cancer Spheroids and Evaluation of NK Cell Infiltration Through a Flow-Based Analysis

Affiliations

Physical Characterization of Colorectal Cancer Spheroids and Evaluation of NK Cell Infiltration Through a Flow-Based Analysis

Azzurra Sargenti et al. Front Immunol. .

Abstract

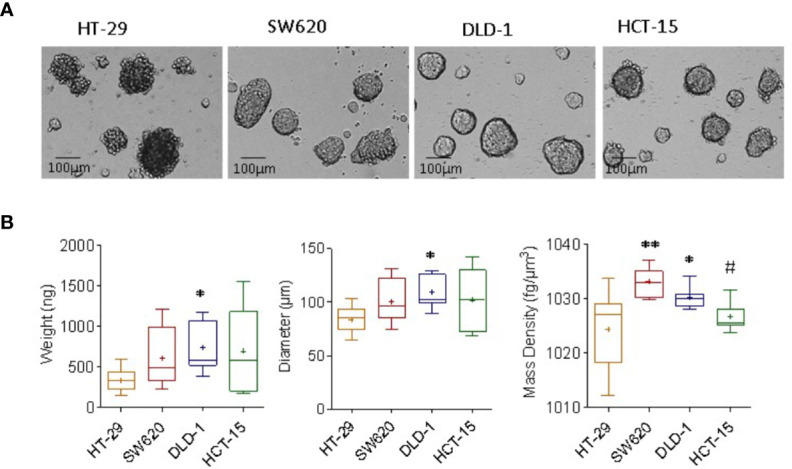
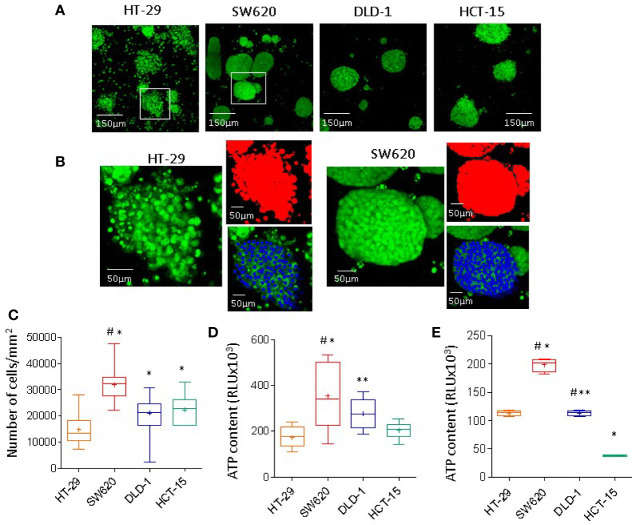
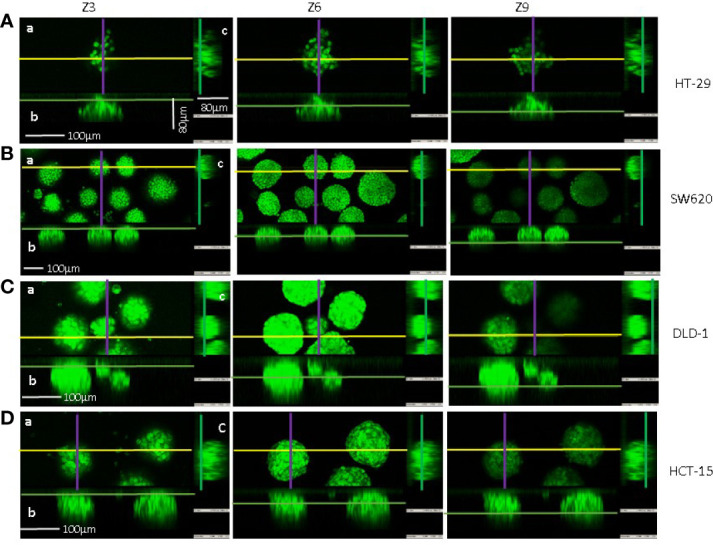
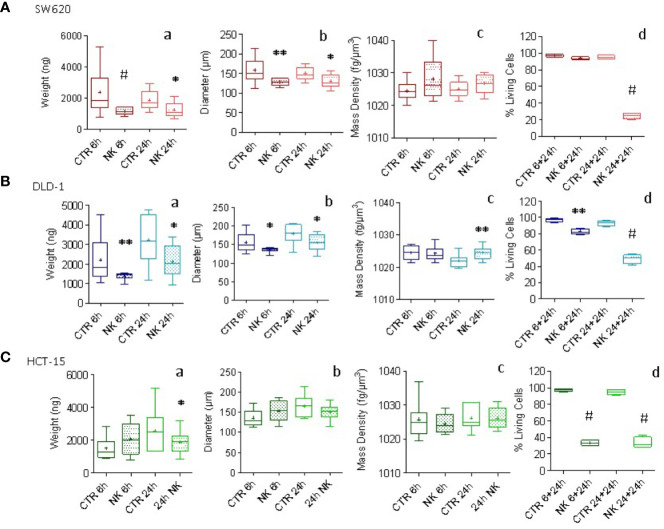
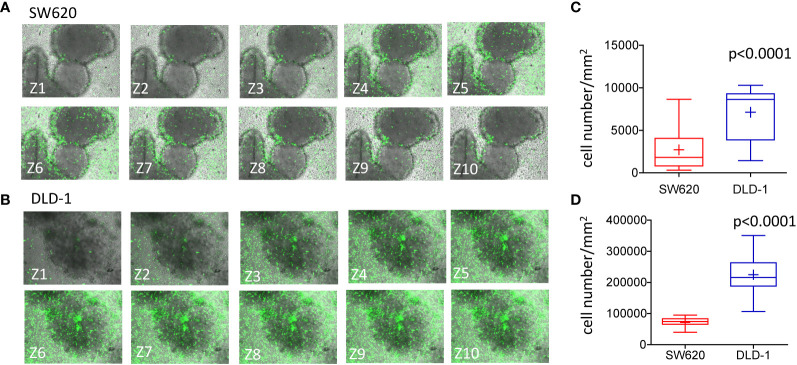
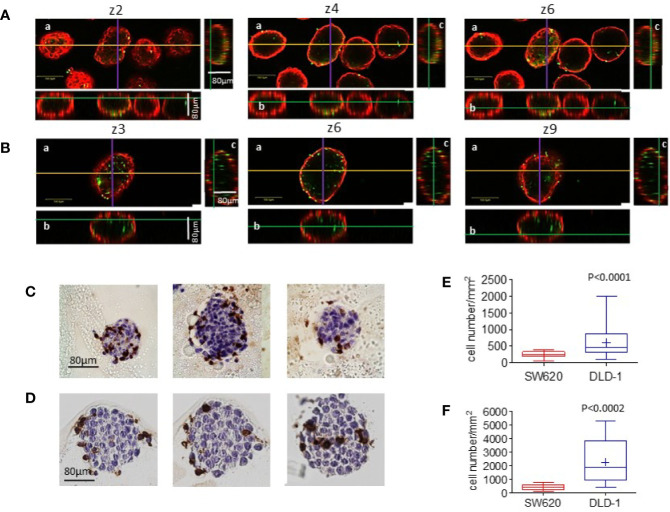
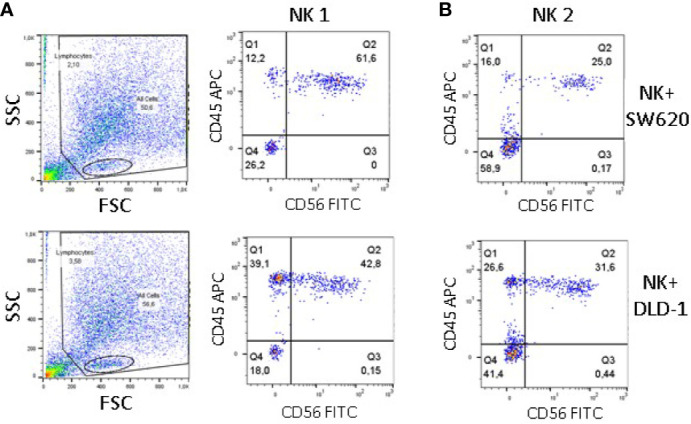
To improve pathogenetic studies in cancer development and reliable preclinical testing of anti-cancer treatments, three-dimensional (3D) cultures, including spheroids, have been widely recognized as more physiologically relevant in vitro models of in vivo tumor behavior. Currently, the generation of uniformly sized spheroids is still challenging: different 3D cell culture methods produce heterogeneous populations in dimensions and morphology, that may strongly influence readouts reliability correlated to tumor growth rate or antitumor natural killer (NK) cell-mediated cytotoxicity. In this context, an increasing consensus claims the integration of microfluidic technologies within 3D cell culture, as the physical characterization of tumor spheroids is unavoidably demanded to standardize protocols and assays for in vitro testing. In this paper, we employed a flow-based method specifically conceived to measure weight, size and focused onto mass density values of tumor spheroids. These measurements are combined with confocal and digital imaging of such samples. We tested the spheroids of four colorectal cancer (CRC) cell lines that exhibit statistically relevant differences in their physical characteristics, even though starting from the same cell seeding density. These variations are seemingly cell line-dependent and associated with the number of growing cells and the degree of spheroid compaction as well, supported by different adenosine-triphosphate contents. We also showed that this technology can estimate the NK cell killing efficacy by measuring the weight loss and diameter shrinkage of tumor spheroids, alongside with the commonly used cell viability in vitro test. As the activity of NK cells relies on their infiltration rate, the in vitro sensitivity of CRC spheroids proved to be exposure time- and cell line-dependent with direct correlation to the cell viability reduction. All these functional aspects can be measured by the system and are documented by digital image analysis. In conclusion, this flow-based method potentially paves the way towards standardization of 3D cell cultures and its early adoption in cancer research to test antitumor immune response and set up new immunotherapy strategies.

Keywords: 3D cell culture; colorectal cancer; mass density; microfluidics; natural killer cells; spheroid; weight.


Conflict of interest statement

The authors of Affiliation 1 (AS, FM, FB, DC, FC, SB, SP, and DG) are employed by Cell Dynamics isrl company. The authors declare that a Patent Application (No. 102020000006031) incorporating parts of this work has been filed. DG, SB, DC, AS, and FM are the inventors of patent No. 102020000006031. The remaining authors declare that the research was conducted in the absence of any commercial or financial relationships that could be construed as a potential conflict of interest.

Figures

Figure 1
Figure 1
Measurement of mass density, weight and diameter of CRC spheroids. (A) CRC spheroids were generated with HT-29, SW620, DLD-1, and HCT-15 CRC cell lines cultured in ultra-low adherent flat-bottomed microplates and analyzed on day 6 by inverted IX70 microscope (Olympus); images were taken with 20x objective NA 0.40 (200x magnification). Bar in each panel: 100μm. (B) CRC spheroid samples were fixed with 4% PFA and analyzed with the flow-based system. Data are graphically depicted in box-and-whisker plots and the lines, extending from the boxes, indicate variability outside the upper and lower quartiles. Results are expressed as the weight (ng, left graph), diameter (μm, central graph) and mass density (fg/μm3, right graph). *p< 0.05 and **p< 0.001 vs HT-29. #p<0.05 vs DLD-1.
Figure 2
Figure 2
CRC spheroids cell composition and viability. (A) CRC spheroids of HT-29, SW620, DLD-1, or HCT-15 were stained with 1µM Syto16 Green, seeded into a 96w Cell Imaging plate (Eppendorf) and run under the FV500 laser scanning confocal microscope (200x). Images were taken at different Z points set every 10μm (one representative is shown), with FluoView 4.3b software (Olympus GmbH). (B) Image analysis (Image J software) of a spheroid of HT-29 (left) or SW620 (right); enlargement of the white squares in A. Spheroids identified in red pseudocolor, nuclei evidenced in blue pseudocolor. (C) Nuclei were counted with the multipoint and analyze particle tool; results are expressed as cell number/area (mm2) and are the mean±SD of 30 spheroid/cell line counted on 6 Z points/spheroid. ANOVA was performed to evaluate the differences between groups, followed by the Tukey-HSD posthoc test. *p<0.0001 vs HT-29, #p<0.0001 vs DLD-1 and HCT-15. (D) Intracellular ATP content measured using the CellTiter-Glo® Luminescent Cell Viability Kit (Promega). Results are expressed as relative light units (RLU) and are the mean±SD of 16 wells/spheroid cell line. Two-tailed unpaired Student’s t-test was performed to calculate statistical significance. *p<0.0001 vs HT-29, **p<0.001 vs HT-29, #p<0.0001 vs HCT-15. (E) Intracellular ATP content in 20x103 cells for each cell line, rescued from subconfluent (70%) cultures and kept in suspension. Results are expressed as in (D) and are the mean±SD of 4 wells/cell line. Two-tailed unpaired Student’s t-test was performed to calculate statistical significance. *p<0.0001 vs HT-29, **p<0.0001 vs SW620, #p<0.0001 vs HCT-15.
Figure 3
Figure 3
Confocal microscopy and imaging of CRC spheroid shape. Spheroids of HT-29 (A), SW620 (B), DLD-1 (C), or HCT-15 (D) cell lines were stained with 1µM Syto16 Green Fluorescent Nucleic Acid Stain and run under the FV500 laser scanning confocal microscope. Images were taken with a 20x objective 0.40 NA, at Z points set every 8μm, with FluoView 4.3b software (Olympus). Orthogonal cross-section (indicated as follows: yellow for x axis, purple for y axis and green for z axis) were reconstructed from a set of a z-stack scans (12 sections for 80–96 µm total thickness: z3, z6, z9 are shown for each cell line). For each panel (A–C): a) an example of x-y focal plane of the z reported in the subpanel a; b) side view of the z-stack (orthogonal x-z plane) for subpanel a); c) view in the orthogonal y-z plane for subpanel a. Bar: 100µm are indicated in panels (A–D) of z3.
Figure 4
Figure 4
Evaluation of NK cell killing of CRC spheroids. CRC spheroids generated with SW620 (A), DLD-1 (B) and HCT-15 (C) cell lines were incubated at 37°C with NK cells at the effector:target (E:T) ratio of 1:1 for 6h or 24h. Then, samples were fixed with 4% PFA and analyzed with the flow-based system. Data are graphically depicted in boxes-and-whisker plots and the lines extending from the boxes indicate variability outside the upper and lower quartiles. Results are expressed as weight (ng, a), diameter (μm, b) and mass density (fg/μm3, c). (graph d of A, B, C) Cytolytic activity evaluated in parallel samples at 6h or 24h (+additional 24h to allow living cell attachment) with the Crystal Violet Cell Cytotoxicity Assay Kit (Biovision). The amount of crystal violet proportional to the amount of living cells was measured with the VICTORX5 multilabel plate reader (Perkin Elmer) at the optical density (O.D.) of 595nm. Results are expressed as the percentage of living cells compared to CRC spheroids without NK cells. A-C: *p<0.05; **p<0.001, #p<0.0005.
Figure 5
Figure 5
Infiltration of CRC spheroids by NK cells.I. (A, B): SW620 (A) or DLD-1 (B) spheroids were seeded into a Matrigel dome in Cell Imaging plates (Eppendorf) and incubated with CFSE-labeled NK cells (E:T ratio of 1:1) for 24h. Samples were run under the FV500 confocal microscope and analyzed with FluoView 4.3b software (Olympus). Images were taken at different Z planes (Z1-Z10) every 10μm with a 20x objective NA 0.40 and shown as green CFSE+ NK cells merged with bright field spheroids. (C, D): NK cells present in each Z plane were counted with the Multipoint Analyze Particle tool of the Image J software and plotted as the number of NK cells/mm2 infiltrating SW620 (red boxes and whiskers) or DLD-1 (blue boxes and whiskers) and the mean±SD of 10 Z plans of a single spheroid (C) or mean±SD of NK cells/mm2 infiltrating 20 spheroids evaluated each at 10 different Z positions (D).
Figure 6
Figure 6
Infiltration of CRC spheroids by NK cells II. (A-B): SW620 (A) or DLD-1 (B) spheroids were seeded as in Figure 5 , incubated with CFSE-labeled NK cells (green, E:T ratio of 1:1) for 24h, washed and counterstained with the anti-ESA mAb TROP-1, followed by Alexafluor647-GAM (red). Samples were run under the FV500 confocal microscope and analyzed with FluoView 4.3b software (Olympus). Images were taken at different Z planes (Z1-Z10) with a 20x objective NA 0.40: three representative z stack sections are shown. Orthogonal cross-section (indicated as yellow line for x axis, purple for y axis and green for z axis) were reconstructed from z-stack scans (80 µm total thickness). For each panel: a) an example of x-y focal plane of the z reported in the subpanel a; b) side view of the z-stack (orthogonal x-z plane) for subpanel a); c) view in the orthogonal y-z plane for subpanel a. Bar in subpanels a: 100µm. (C, D): Other samples of SW620 (C) or DLD-1 (D) spheroids incubated with NK cells were fixed, suspended in melted agarose and paraffin embedded. Four µm thick serial sections were cut (3 sections every 15 µm) and stained with the anti-CD45 LCA mAb, visualized with DAB chromogen (brown) and a hematoxylin counterstain. Digital images were acquired using the Aperio ScanScope Slide program of the Aperio AT2 Scanner with a 40X objective. (E, F): The number of infiltrating cells was calculated with the Image J Multipoint Analyze Particle tool on the ROI designed on the inner spheroid perimeter (graph E), defined on the basis of ESA staining showed in A and B, or on the visible spheroid perimeter (graph F) in the IHC stained specimens depicted in C and D. This is the main reason for the different NK cell number counted in E vs F. Six spheroids/cell line were analyzed at 10 different Z positions in (E) or on 10 serial sections in (F) Results are expressed as cell number/mm2. p<0.0001 (E) or p<0.0002 (F) vs SW620.
Figure 7
Figure 7
Infiltration of CRC spheroids by NK cells evaluated by cytofluorimetry. SW620 (upper panels) or DLD-1 (lower panels) spheroids were incubated with NK cells from two donors (NK1, panel A and NK2, panel B), as in Figure 4 , washed and stained with the anti-CD56 mAb C218, followed by Alexafluor488 anti-isotype-specific GAM. After dissociation in phosphate buffer without Ca++/Mg++, the resulting cell suspension was labeled with the anti-CD45 mAb 9.4, followed by Alexafluor647 anti-isotype-specific GAM. Samples were run on a MACS Quant cytofluorimeter, 10,000 events were recorded and gating was performed on lymphocytes (panel A, left plots) Results, analyzed with the Flow Jo software, are expressed as Log green fluorescence intensity (a.u.) vs Log far-red fluorescence intensity (a.u.).In each quadrant are reported the percentage of single-positive (upper left and lower right) double-negative (lower left) or double-positive (upper right) cells.

Similar articles

Cited by

References

    1. Breslin S, O’Driscoll L. Three-dimensional cell culture: the missing link in drug discovery. Drug Discov Today (2013) 18(5–6):240–9. 10.1016/j.drudis.2012.10.003 - DOI - PubMed
    1. Lovitt CJ, Shelper TB, Avery VM. Advanced Cell Culture Techniques for Cancer Drug Discovery. Biology (2014) 3(2):345–67. 10.3390/biology3020345 - DOI - PMC - PubMed
    1. Costa EC, Moreira AF, de Melo-Diogo D, Gaspar VM, Carvalho MP, Correia IJ. 3D tumor spheroids: an overview on the tools and techniques used for their analysis,”. Biotechnol Adv (2016) 34(8):1427–41. 10.1016/j.biotechadv.2016.11.002 - DOI - PubMed
    1. Verjans ET, Doijen J, Luyten W, Landuyt B, Schoofs L. Three-dimensional cell culture models for anticancer drug screening: Worth the effort? J Cell Physiol (2018) 233:2993–3003. 10.1002/jcp.26052 - DOI - PubMed
    1. Zimmermann M, Box C, Eccles SA. Two-dimensional vs. three-dimensional in vitro tumor migration and invasion assays. Methods Mol Biol (2013) 986:227–52. 10.1007/978-1-62703-311-4_15 - DOI - PubMed

Publication types

MeSH terms