. 2020 Dec 23:11:599982.
doi: 10.3389/fpls.2020.599982. eCollection 2020.

Regulation of Early Plant Development by Red and Blue Light: A Comparative Analysis Between Arabidopsis thaliana and Solanum lycopersicum

Affiliations

Regulation of Early Plant Development by Red and Blue Light: A Comparative Analysis Between Arabidopsis thaliana and Solanum lycopersicum

Kiki Spaninks et al. Front Plant Sci. .

Abstract

In vertical farming, plants are grown in multi-layered growth chambers supplied with energy-efficient LEDs that produce less heat and can thus be placed in close proximity to the plants. The spectral quality control allowed by LED lighting potentially enables steering plant development toward desired phenotypes. However, this requires detailed knowledge on how light quality affects different developmental processes per plant species or even cultivar, and how well information from model plants translates to horticultural crops. Here we have grown the model dicot Arabidopsis thaliana (Arabidopsis) and the crop plant Solanum lycopersicum (tomato) under white or monochromatic red or blue LED conditions. In addition, seedlings were grown in vitro in either light-grown roots (LGR) or dark-grown roots (DGR) LED conditions. Our results present an overview of phenotypic traits that are sensitive to red or blue light, which may be used as a basis for application by tomato nurseries. Our comparative analysis showed that young tomato plants were remarkably indifferent to the LED conditions, with red and blue light effects on primary growth, but not on organ formation or flowering. In contrast, Arabidopsis appeared to be highly sensitive to light quality, as dramatic differences in shoot and root elongation, organ formation, and developmental phase transitions were observed between red, blue, and white LED conditions. Our results highlight once more that growth responses to environmental conditions can differ significantly between model and crop species. Understanding the molecular basis for this difference will be important for designing lighting systems tailored for specific crops.

Keywords: Arabidopis thaliana; LED lighting; R/B light ratio; development; floral transition; growth; tomato.


Conflict of interest statement

The authors declare that the research was conducted in the absence of any commercial or financial relationships that could be construed as a potential conflict of interest.

Figures

FIGURE 1
FIGURE 1
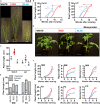
The effect of red and blue light on primary growth of Arabidopsis and tomato seedlings. (A,B) Representative 7 day old Arabidopsis and 5 day old tomato seedlings grown in white, red, or blue LED conditions. Seedlings of Arabidopsis ecotype Columbia (Col-0) (A) and tomato cultivar Moneymaker (MM) (B) were grown in light-grown roots (LGR) and dark-grown roots (DGR) LED conditions. For presentation purposes, seedlings were transferred to black agarose plates before photographing. Scale bars indicate 1 cm. (C–E) Quantification of the hypocotyl length of DGR seedlings (C) and the primary root length of LGR and DGR seedlings (D,E) of Arabidopsis ecotypes Col-0 and Landsberg erecta (Ler) and tomato cultivars MM and Foundation (FO) as shown in (A,B, and Supplementary Figures S4A, S5A), respectively. LED conditions and ecotypes or cultivars were compared using a one-way ANOVA followed by a Tukey’s test (letters a–f indicate statistically significant differences values, p < 0.05) in (C–E). Error bars represent standard error of the mean in (C–E) (n = 30). Similar results were obtained in three independent experiments.
FIGURE 2
FIGURE 2
Red light promotes shoot growth in Arabidopsis and young tomato plants. (A) Representative Arabidopsis Columbia (Col-0) plants grown in white, red, or blue LED conditions until 4 weeks after bolting. (B,C) Quantification of the plant height over time (B) or the plant height after termination of the primary inflorescence (C) of Arabidopsis Col-0 or Landsberg erecta (Ler) plants as shown in (A and Supplementary Figure S4E), respectively. (D) Representative tomato Moneymaker (MM) plants grown in white, red, or blue LED conditions until 45 days after sowing (DAS). (E,F) Quantification of the plant height at 45 DAS (E), or the plant height, hypocotyl length, or epicotyl length over time (F) of tomato MM or Foundation (FO) plants as shown in (D and Supplementary Figure S5D), respectively. LED conditions and ecotypes or cultivars were compared using a one-way ANOVA followed by a Tukey’s test (letters a–d indicate statistically significant differences, p < 0.05) in (C). In (B,E,F), monochromatic LED conditions (red or blue) were compared to white (control) using a two-sided Student’s t-test (asterisks indicate significant differences (p < 0.05) in time series in (B,F), or in plant height in (E), bullets indicate significant differences (p < 0.05) in hypocotyl or epicotyl length in (E). Error bars represent standard error of the mean in (C), standard errors for (B,E,F) are listed in Supplementary Table S2 (n = 20). Dashed arrows in (B) represent the time from bolting until termination of the primary inflorescence. For presentation purposes, pots were placed in front of a black background in (A,D) before photographing. Scale bars indicate 10 cm in (A), and 5 cm in (D). Similar results were obtained in two independent experiments.
FIGURE 3
FIGURE 3
Monochromatic red light promotes shoot growth and inhibits root branching in Arabidopsis. (A) Shoot-root ratio of 7 day old Arabidopsis seedlings (left) and 5 day old tomato seedlings (right), grown in white, red, or blue LED conditions. Arabidopsis ecotypes Columbia (Col-0) and Landsberg erecta (Ler), and tomato cultivars Moneymaker (MM) and Foundation (FO) were grown in dark-grown roots (DGR) LED conditions. (B) Number of primary (Prim), secondary (Sec) and tertiary (Tert) branches from the primary inflorescence of Arabidopsis Col-0 and Ler plants grown in LED conditions until termination of the primary inflorescence. (C) Lateral root density of 14-day old Col-0 and Ler seedlings grown in light-grown roots (LGR) and DGR LED conditions. Graph colors represent the LED conditions in (A,C). LED conditions and ecotypes or cultivars were compared using a one-way ANOVA followed by a Tukey’s test (letters a–d indicate statistically significant differences, p < 0.05) in (A,C). In (B), monochromatic LED conditions (red or blue) were compared to white (control) using a two-sided Student’s t-test [bullets indicate significant differences in secondary branches (p < 0.05), asterisks indicate significant differences in tertiary branches (***p < 0.001, **p < 0.01)]. Error bars represent standard error from mean in (A,C) (n = 30), standard errors for (B) are listed in Supplementary Table S2 (n = 20). Similar results were obtained in three (A,C) or two (B) independent experiments.
FIGURE 4
FIGURE 4
Developmental phase transitions in Arabidopsis are promoted by blue light and delayed by red light. (A) Rosette phenotype of representative Arabidopsis plants of ecotype Columbia (Col-0) grown in white, red, or blue LED conditions. (B) Quantification of rosette surface area (RSA) of Col-0 or Landsberg erecta (Ler) plants as shown in (A and Supplementary Figure S4B), respectively. (C) Representative Arabidopsis Col-0 plants grown in LED conditions until 1 week after flowering. (D) Rosette leaf appearance in Col-0 and Ler plants over time. (E) Flowering time (until bolting, or until the appearance of flower buds) of Col-0 and Ler plants in number of days. (F) Rosette leaves of representative Col-0 plants and length/width ratios of the leaf blade (± SE, n = 10). Scale bars represent 1 cm in (A,F), and 10 cm in (C). Graph colors represent the LED conditions in (B,D,E). LED conditions and ecotypes were compared using a one-way ANOVA followed by a Tukey’s test (letters a–d indicate statistically significant differences, p < 0.05) in (B,E). In (D,F), monochromatic LED conditions (red or blue) were compared to white (control) using a two-sided Student’s t-test [asterisks indicate significant differences (*p < 0.05, ***p < 0.001)]. Error bars represent standard error of the mean in (B,E) (n = 30), standard errors for (D) are listed in Supplementary Table S2 (n = 30). Dashed lines in (D) represent the time of bolting. Similar results were obtained in two independent experiments.
FIGURE 5
FIGURE 5
Developmental phase transitions in tomato are indifferent to R/B light ratios. (A) Representative tomato plants of cultivar Moneymaker (MM) grown in white, red, or blue LED conditions until 30 days after sowing (DAS). (B) Flowering time of MM and Foundation (FO) plants in number of days. (C) Leaf appearance over time in MM and FO plants. (D,E) Representative compound leaves from MM plants grown in LED conditions until 45 DAS: leaf #4 (D) and leaf #6 (E). For presentation purposes, leaves were removed, flattened, and placed on black paper. (F) Quantification of leaf surface area (LSA) of MM and FO leaves shown in (D,E, and Supplementary Figures S5B,C), respectively. Scale bars represent 5 cm in (A,D,E). Graph colors represent the LED conditions in (B,C,F). LED conditions and cultivars were compared using a one-way ANOVA followed by a Tukey’s test (letters a–d indicate statistically significant differences, p < 0.05) in (B,F). In (C), monochromatic LED conditions (red or blue) were compared to white (control) using a two-sided Student’s t-test [n.s. indicates no significant differences between LED conditions (p < 0.05)]. Error bars represent standard error of the mean in (B,F) (n = 20), standard errors for (C) are listed in Supplementary Table S2 (n = 20). Similar results were obtained in two independent experiments.

References

    1. Ballaré C. L., Barnes P. W., Flint S. D. (1995). Inhibition of hypocotyl elongation by ultraviolet−B radiation in de−etiolating tomato seedlings. I. The photoreceptor. Physiol. Plant. 93 584–592. 10.1111/j.1399-3054.1995.tb05104.x - DOI
    1. Ballaré C. L., Pierik R. (2017). The shade-avoidance syndrome: multiple signals and ecological consequences. Plant Cell Environ. 40 2530–2543. 10.1111/pce.12914 - DOI - PubMed
    1. Ballaré C. L., Scopel A. L., Sánchez R. A. (1990). Far-red radiation reflected from adjacent leaves: AN early signal of competition in plant canopies. Science 247 329–332. 10.1126/science.247.4940.329 - DOI - PubMed
    1. Brandt S., Fachinger S., Tohge T., Fernie A. R., Braun H. P., Hildebrandt T. M. (2018). Extended darkness induces internal turnover of glucosinolates in Arabidopsis thaliana leaves. PLoS One 13:e0202153. 10.1371/journal.pone.0202153 - DOI - PMC - PubMed
    1. Brewer P. B., Koltai H., Beveridge C. A. (2013). Diverse roles of strigolactones in plant development. Mol. Plant 6 18–28. 10.1093/mp/sss130 - DOI - PubMed

LinkOut - more resources