

Genome-Wide Analysis of the GRAS Gene Family and Functional Identification of GmGRAS37 in Drought and Salt Tolerance
- PMID: 33424904
- PMCID: PMC7793673
- DOI: 10.3389/fpls.2020.604690
Genome-Wide Analysis of the GRAS Gene Family and Functional Identification of GmGRAS37 in Drought and Salt Tolerance
Abstract
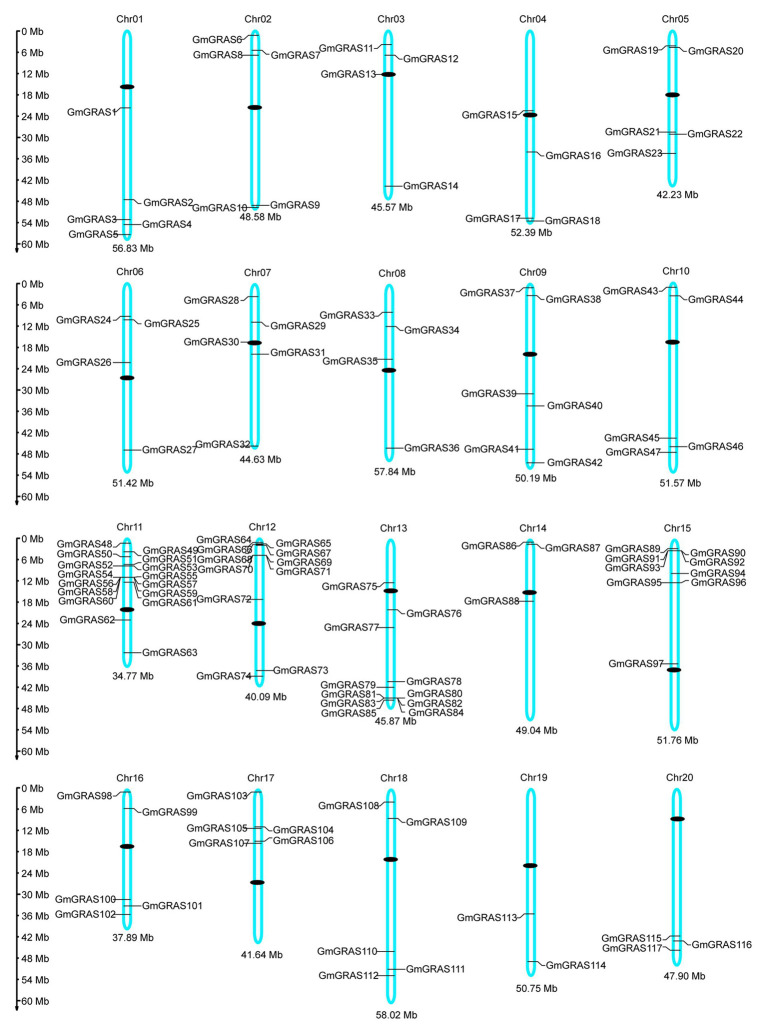
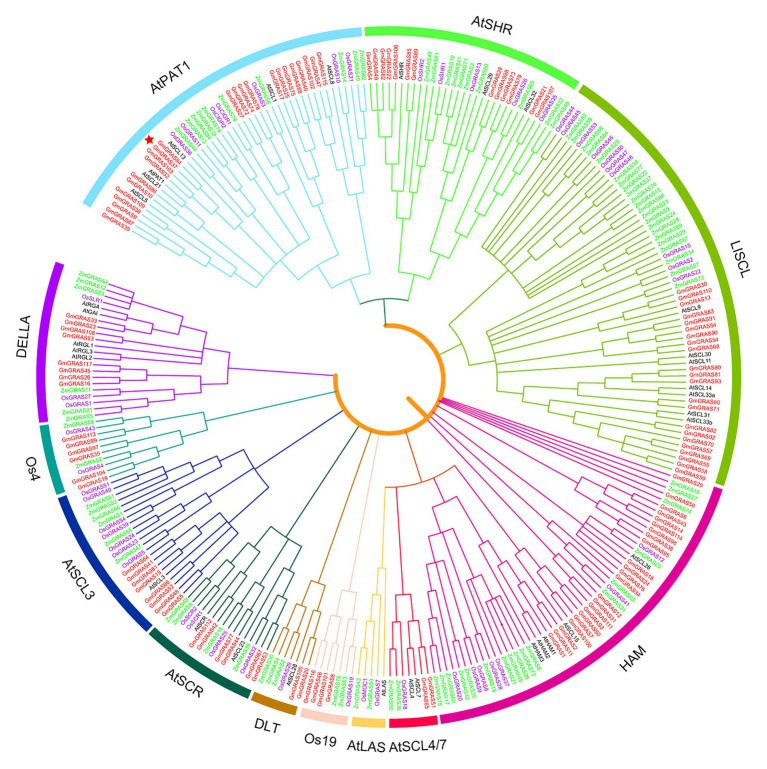
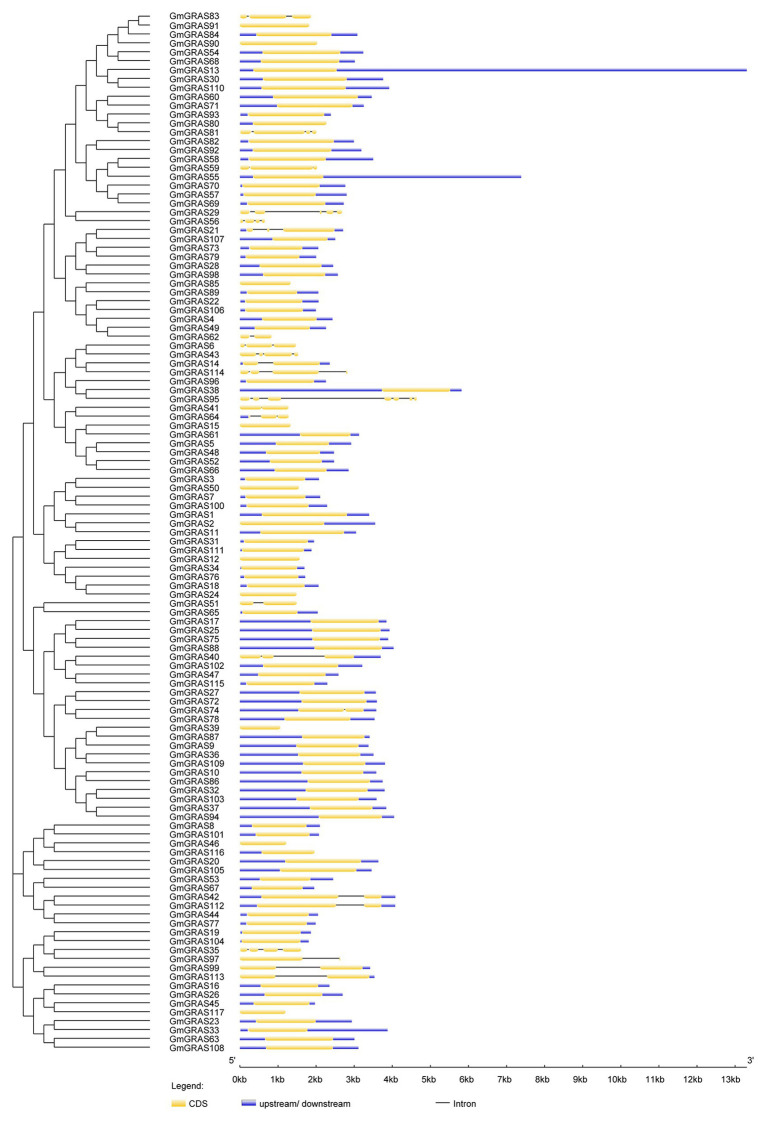
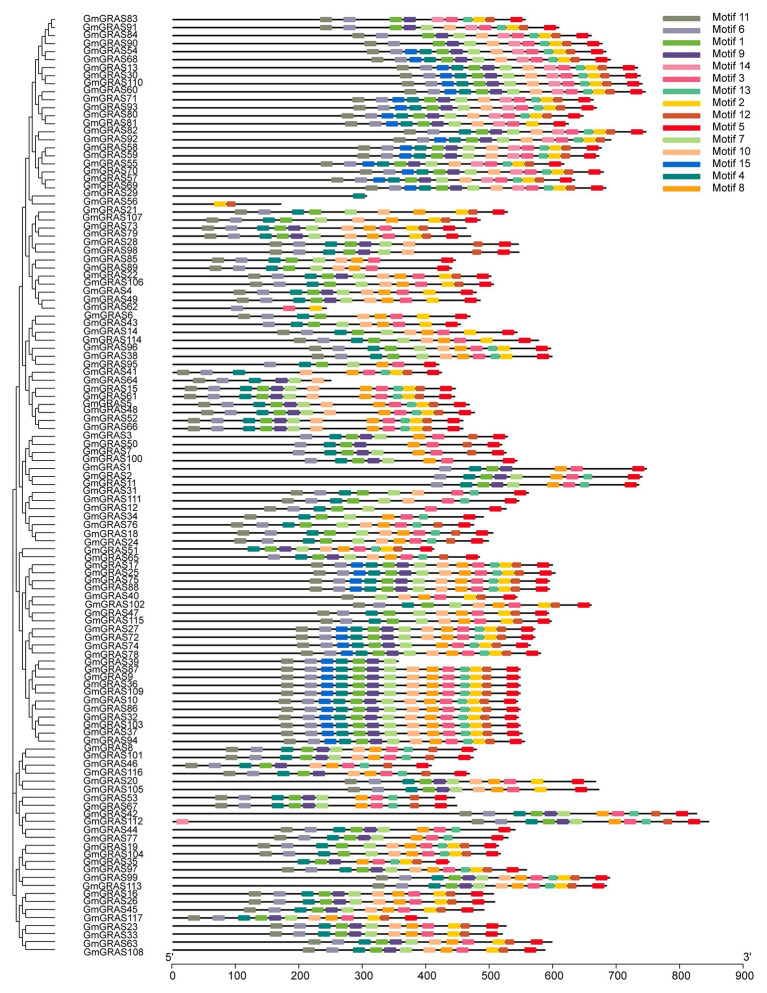
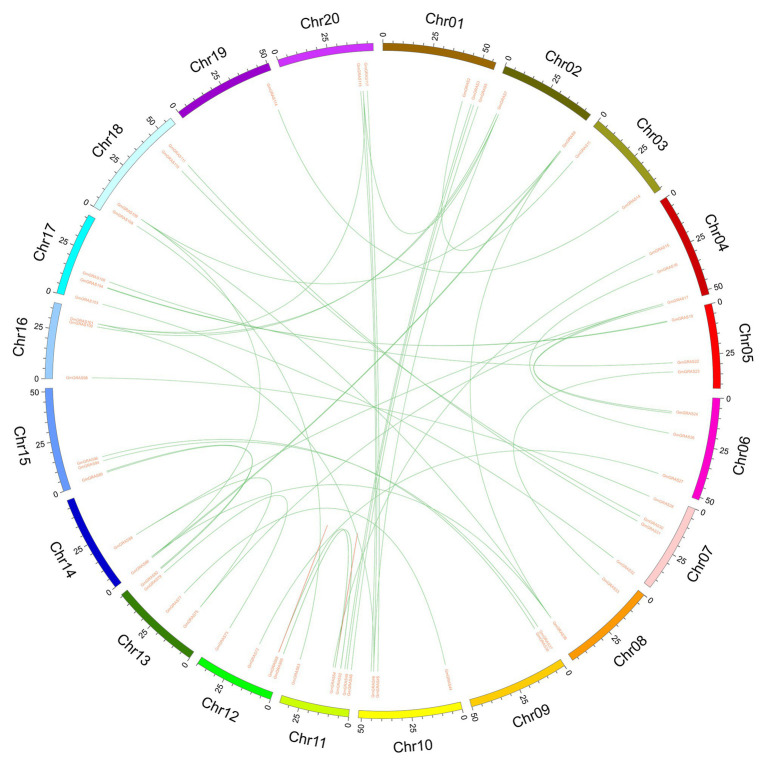
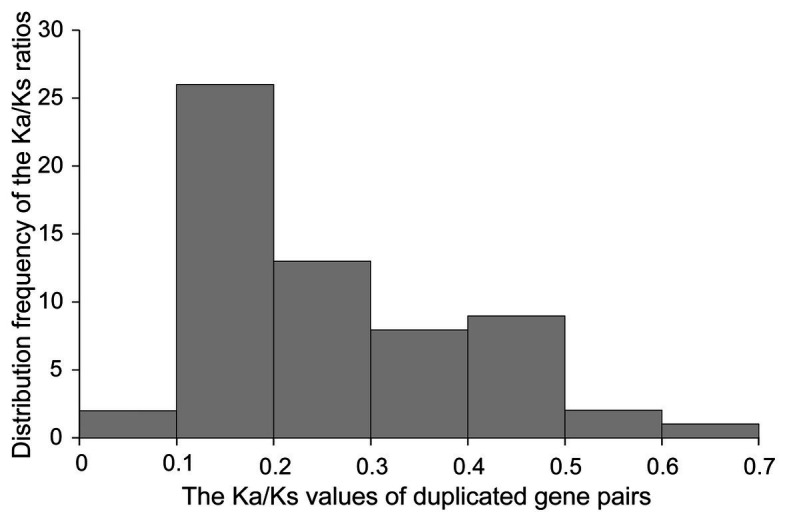
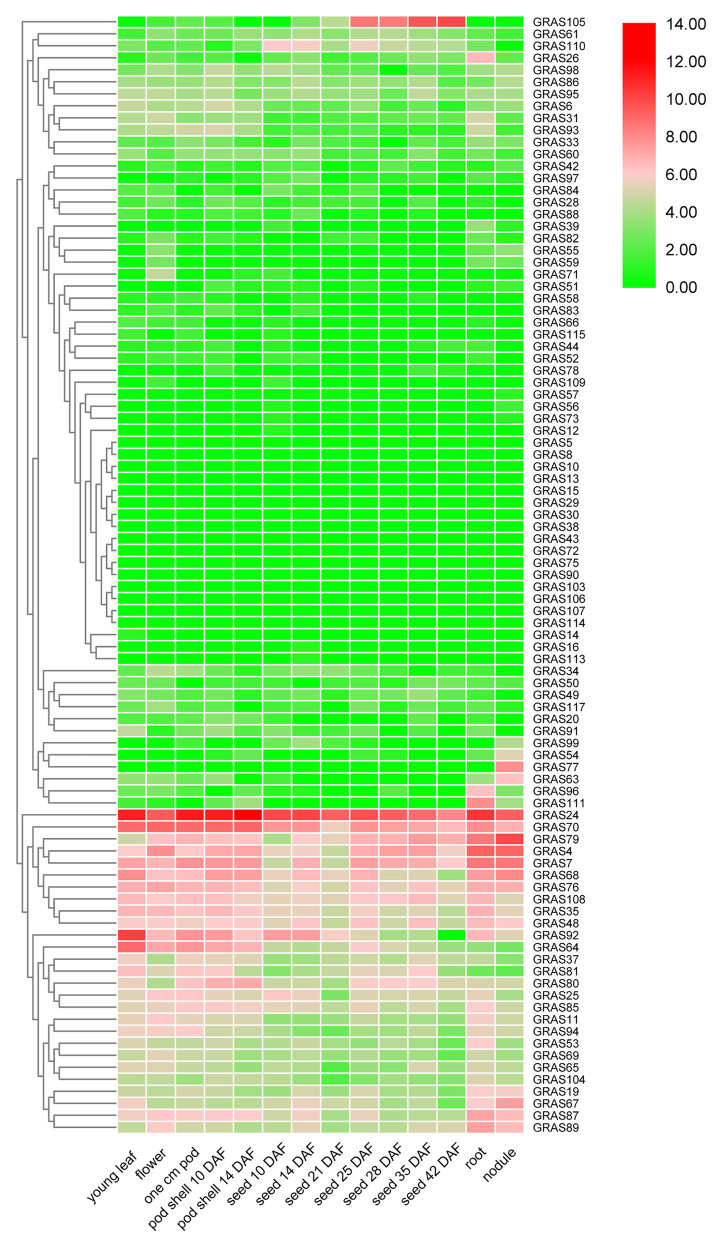
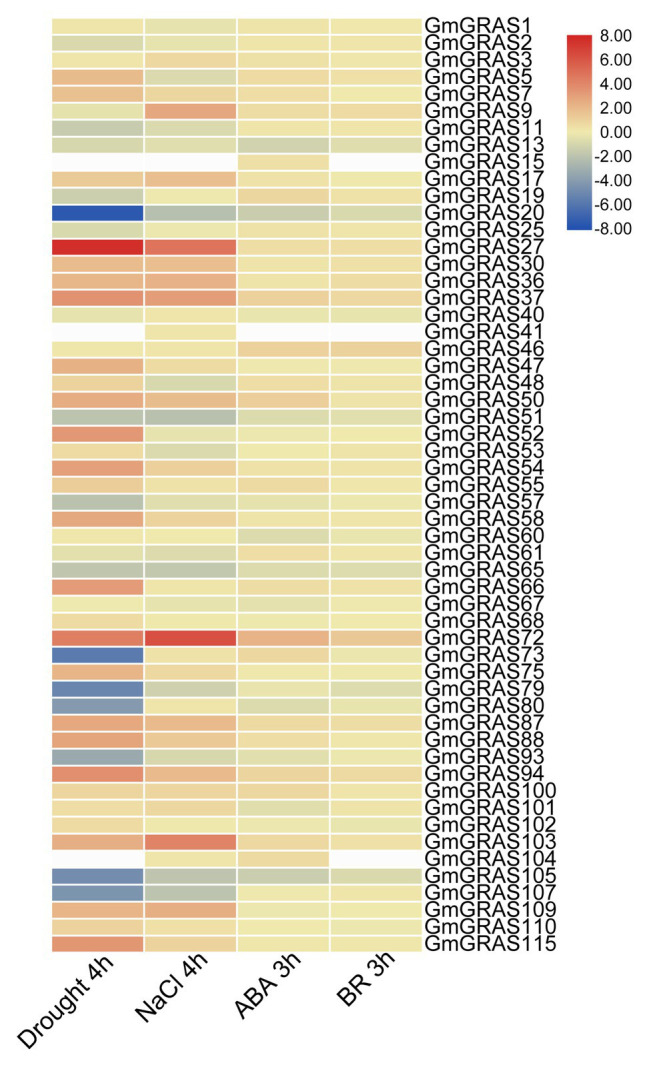
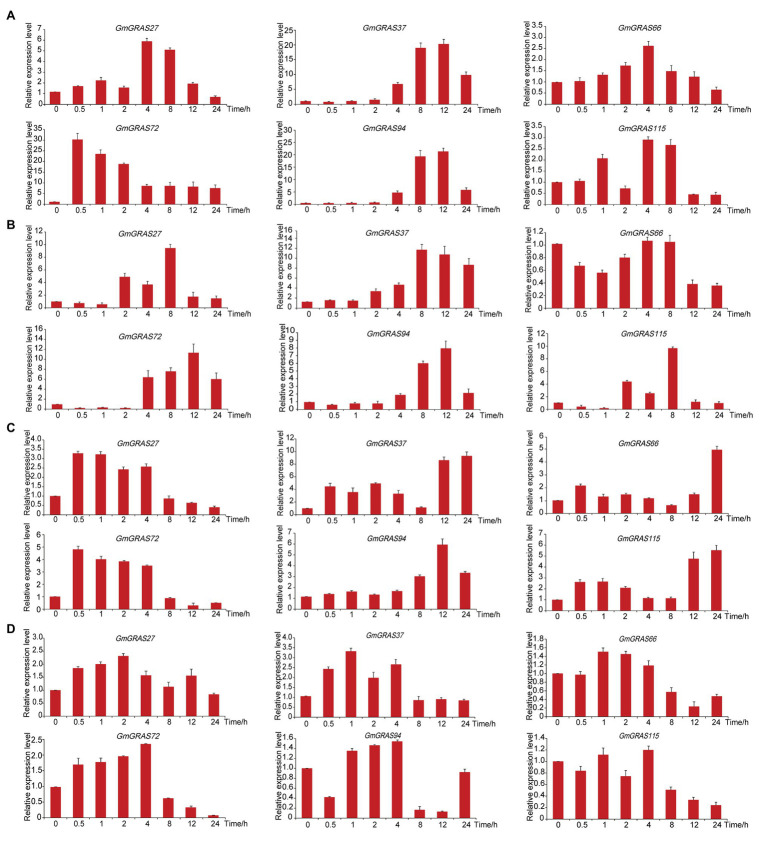
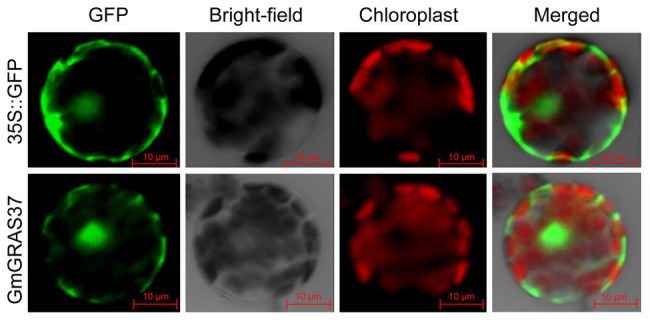
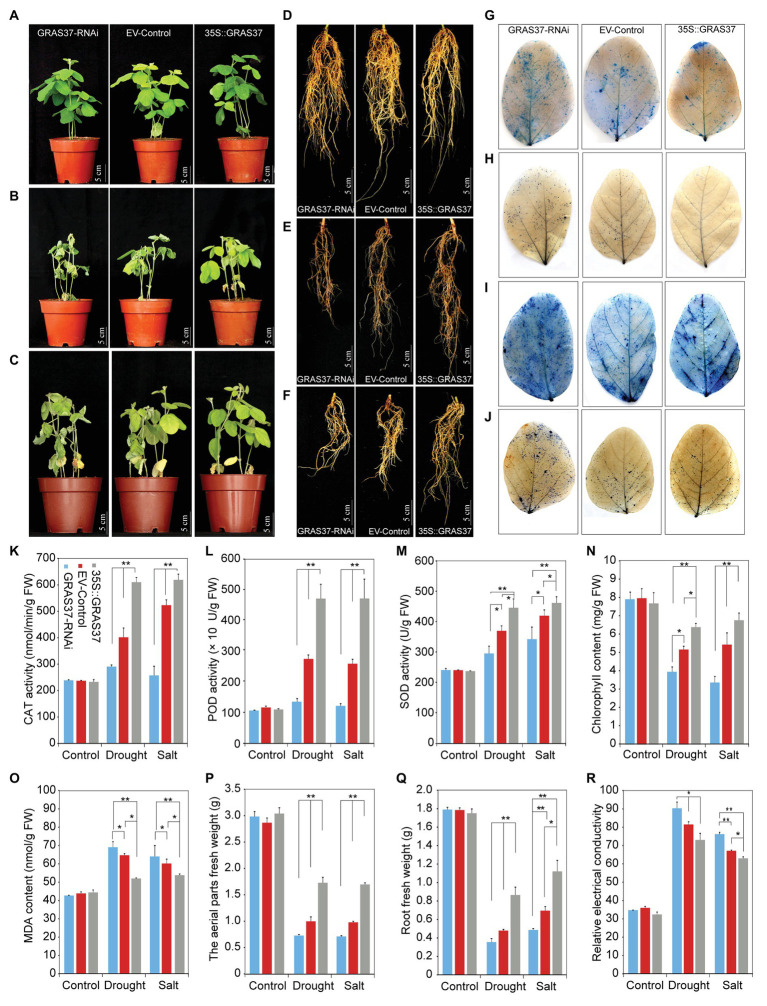
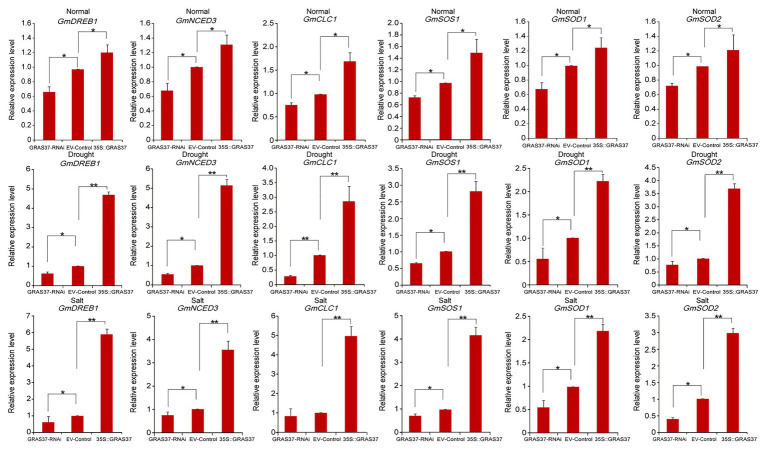
GRAS genes, which form a plant-specific transcription factor family, play an important role in plant growth and development and stress responses. However, the functions of GRAS genes in soybean (Glycine max) remain largely unknown. Here, 117 GRAS genes distributed on 20 chromosomes were identified in the soybean genome and were classified into 11 subfamilies. Of the soybean GRAS genes, 80.34% did not have intron insertions, and 54 pairs of genes accounted for 88.52% of duplication events (61 pairs). RNA-seq analysis demonstrated that most GmGRASs were expressed in 14 different soybean tissues examined and responded to multiple abiotic stresses. Results from quantitative real-time PCR analysis of six selected GmGRASs suggested that GmGRAS37 was significantly upregulated under drought and salt stress conditions and abscisic acid and brassinosteroid treatment; therefore, this gene was selected for further study. Subcellular localization analysis revealed that the GmGRAS37 protein was located in the plasma membrane, nucleus, and cytosol. Soybean hairy roots overexpressing GmGRAS37 had improved resistance to drought and salt stresses. In addition, these roots showed increased transcript levels of several drought- and salt-related genes. The results of this study provide the basis for comprehensive analysis of GRAS genes and insight into the abiotic stress response mechanism in soybean.
Keywords: GRAS protein; abiotic stress; genome-wide analysis; hairy root assay; soybean.
Copyright © 2020 Wang, Yu, Fu, Su, Chen, Zhou, Chen, Guo, Ma, Wei and Xu.
Conflict of interest statement
The authors declare that the research was conducted in the absence of any commercial or financial relationships that could be construed as a potential conflict of interest.
Figures
Similar articles
-
Genome-wide study of the GRAS gene family in Hibiscus hamabo Sieb. et Zucc and analysis of HhGRAS14-induced drought and salt stress tolerance in Arabidopsis.Plant Sci. 2022 Jun;319:111260. doi: 10.1016/j.plantsci.2022.111260. Epub 2022 Mar 21. Plant Sci. 2022. PMID: 35487668
-
Genome-Wide Analysis of the DUF4228 Family in Soybean and Functional Identification of GmDUF4228 -70 in Response to Drought and Salt Stresses.Front Plant Sci. 2021 May 17;12:628299. doi: 10.3389/fpls.2021.628299. eCollection 2021. Front Plant Sci. 2021. PMID: 34079564 Free PMC article.
-
Genome-Wide Analysis of the DYW Subgroup PPR Gene Family and Identification of GmPPR4 Responses to Drought Stress.Int J Mol Sci. 2019 Nov 12;20(22):5667. doi: 10.3390/ijms20225667. Int J Mol Sci. 2019. PMID: 31726763 Free PMC article.
-
Expression Analyses of Soybean VOZ Transcription Factors and the Role of GmVOZ1G in Drought and Salt Stress Tolerance.Int J Mol Sci. 2020 Mar 21;21(6):2177. doi: 10.3390/ijms21062177. Int J Mol Sci. 2020. PMID: 32245276 Free PMC article.
-
Multifaceted roles of GRAS transcription factors in growth and stress responses in plants.iScience. 2022 Aug 28;25(9):105026. doi: 10.1016/j.isci.2022.105026. eCollection 2022 Sep 16. iScience. 2022. PMID: 36117995 Free PMC article. Review.
Cited by
-
The GRAS gene family in watermelons: identification, characterization and expression analysis of different tissues and root-knot nematode infestations.PeerJ. 2021 May 26;9:e11526. doi: 10.7717/peerj.11526. eCollection 2021. PeerJ. 2021. PMID: 34123598 Free PMC article.
-
Genome-wide identification and expression analysis of the GRAS gene family in response to drought stress in chickpea (Cicer arietinum L.).3 Biotech. 2022 Mar;12(3):64. doi: 10.1007/s13205-021-03104-z. Epub 2022 Feb 9. 3 Biotech. 2022. PMID: 35186661 Free PMC article.
-
Large-Scale Integrative Analysis of Soybean Transcriptome Using an Unsupervised Autoencoder Model.Front Plant Sci. 2022 Mar 3;13:831204. doi: 10.3389/fpls.2022.831204. eCollection 2022. Front Plant Sci. 2022. PMID: 35310659 Free PMC article.
-
Genome-wide identification and expression analysis of the GRAS gene family under abiotic stresses in wheat (Triticum aestivum L.).Sci Rep. 2023 Oct 31;13(1):18705. doi: 10.1038/s41598-023-45051-0. Sci Rep. 2023. PMID: 37907517 Free PMC article.
-
Genome-wide profiling of GRAS genes in flax (Linum usitatissimum L.) reveals LuGRAS30 as a key regulator of drought stress resistance.GM Crops Food. 2025 Dec;16(1):539-561. doi: 10.1080/21645698.2025.2548639. Epub 2025 Aug 25. GM Crops Food. 2025. PMID: 40853041 Free PMC article.
References
-
- Cao D., Li Y., Liu B., Kong F., Tran L. -S. P. (2018). Adaptive mechanisms of soybean grown on salt-affected soils. Land Degrad. Dev. 29, 1054–1064. 10.1002/ldr.2754 - DOI
LinkOut - more resources
Full Text Sources