. 2020 Dec 23:2020:8831937.
doi: 10.1155/2020/8831937. eCollection 2020.

Effect of a Traditional Chinese Medicine Formula (CoTOL) on Serum Uric Acid and Intestinal Flora in Obese Hyperuricemic Mice Inoculated with Intestinal Bacteria

Affiliations

Effect of a Traditional Chinese Medicine Formula (CoTOL) on Serum Uric Acid and Intestinal Flora in Obese Hyperuricemic Mice Inoculated with Intestinal Bacteria

Yan Gao et al. Evid Based Complement Alternat Med. .

Abstract

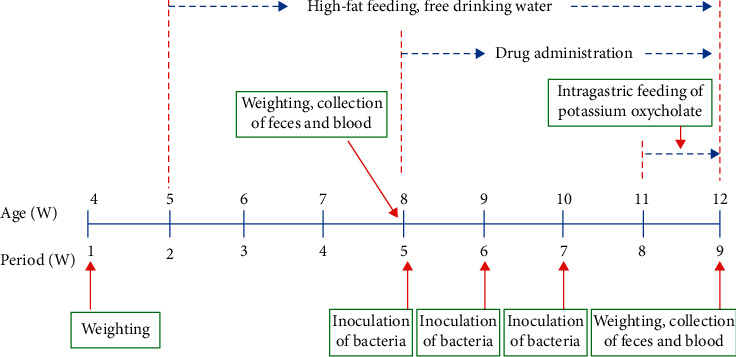
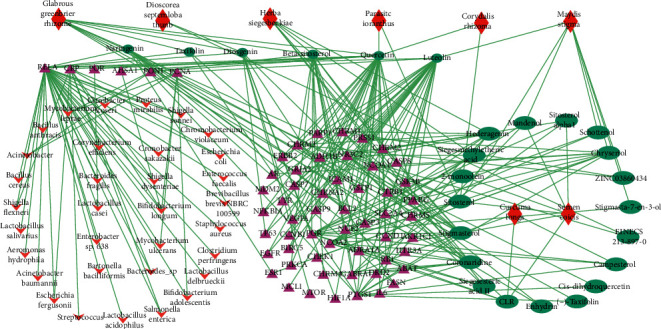
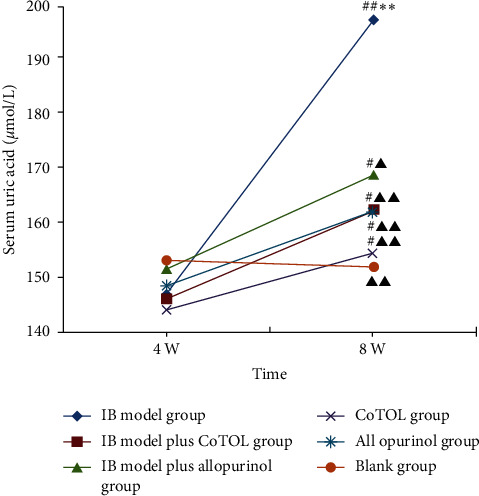
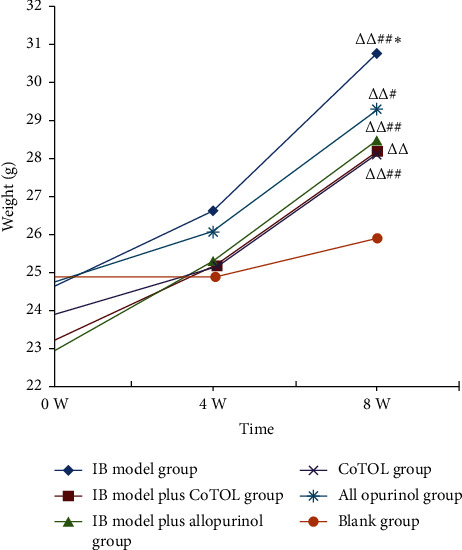
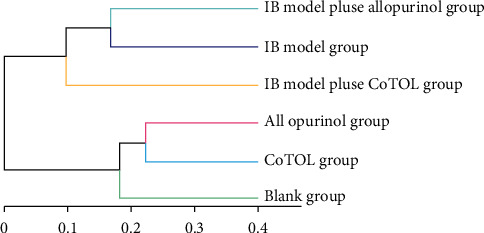
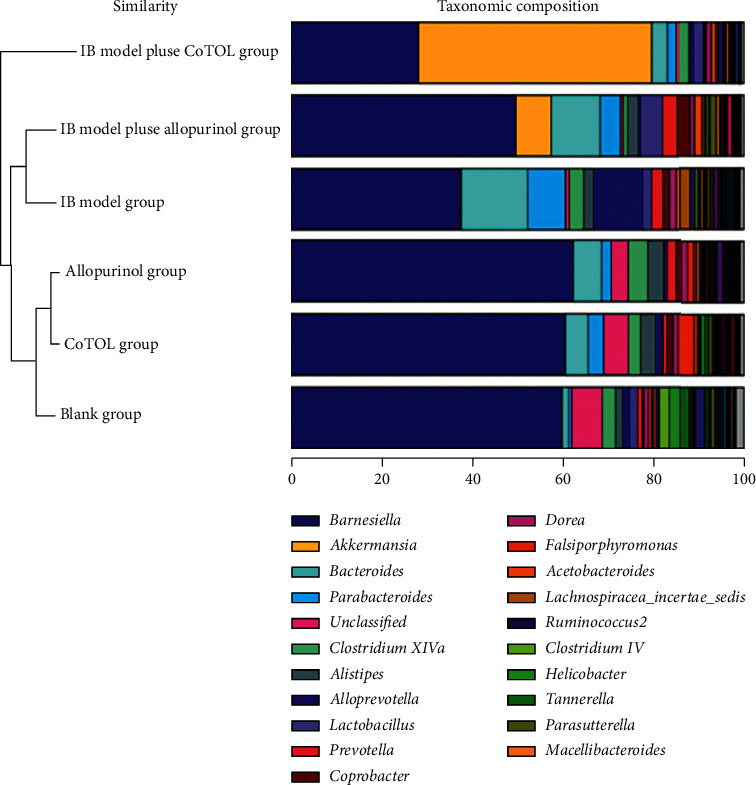
CoTOL is a traditional Chinese medicine (TCM) formula in clinics for treating gout and hyperuricemia, especially in obese patients with recurrent attacks. However, fewer studies have investigated how CoTOL impacts the intestinal flora in reducing uric acid. In the present, we analyze the bacteria targeted by ingredients of CoTOL and evaluate the effects of CoTOL on uric acid and intestinal flora in a mice model of obese hyperuricemia inoculated with xanthine dehydrogenase- (XOD-) producing bacteria, Streptococcus faecalis. Firstly, ingredients of herbs in CoTOL and gene target by these ingredients were retrieved from TCMID 2.0, and these genes were screened by DAVID Bioinformatics Resources 6.8, deciphered to retrieve the bacteria. Then, 3-4-week-old male C57bl/6j mice were randomly divided into 6 groups and fed with high fat diet for 8 weeks up to obesity standard. The mice were inoculated intragastrically with 5 × 10⁹ CFU Streptococcus faecalis 3 times at the 5th, 6th, and 7th week and intragastrically administrated with uricase inhibitor, potassium-oxonate (PO, 250 mg/kg), to induce hyperuricemia at the 8th week, once a day for 7 consecutive days, respectively (IB model). IB model plus CoTOL (0.4 ml/20g) and allopurinol (40 mg/kg) were administrated by gavage at the 5th week, once a day for 4 weeks. The feces and blood in each group were sampled at the 4th and 8th week. With no bacteria inoculation, CoTOL, allopurinol, and blank group were treated with CoTOL and allopurinol or water, respectively. 44 species of bacteria (i.e., Enterococcus faecalis, Streptococcus, etc.) genes were targeted by 6 ingredients of 6 herbs in CoTOL. Inoculation with Streptococcus faecalis significantly caused the elevation of uric acid and the change of intestinal flora structure, whereas treatment with CoTOL significantly increased the abundance of Akkermansia and those of Bacteroides and Alloprevotella decreased. Furthermore, CoTOL exhibited a unique effect on reducing weight unobserved in allopurinol intervention. The present study, for the first time, demonstrated that CoTOL has beneficial effects on hyperuricemia and overweight, which may be attributed to regulating material metabolism and improving the structure or function of intestinal flora. Thus, CoTOL may be a promising therapy for hyperuricemia and overweight in chronic gout management and can be integrated with conventional treatments.


Conflict of interest statement

The authors declare no conflicts of interest.

Figures

Figure 1
Figure 1
Animal model making process.
Figure 2
Figure 2
Bacterial targeted by ingredients of CoTOL. A total of 25 ingredients of the 8 herbs of CoTOL are targeted, of which 6 ingredients of 6 kinds of herbs target 44 bacteria. The red prismatic nodes represent herbs of CoTOL, the green oval nodes represent herbal ingredients, the pink triangular nodes represent the corresponding targets of the herbal ingredients, and the red arrowhead nodes represent the bacteria that target the ingredients.
Figure 3
Figure 3
Body weight variations in each group of mice. After a one-week adaptation period, all mice were randomly divided into six groups: IB model group (obese hyperuricemia model inoculated with bacteria), IB model plus CoTOL group (IB model treated with CoTOL), IB model plus allopurinol group (IB model treated plus allopurinol), CoTOL group (obese hyperuricemia model treated with CoTOL), allopurinol group (obese hyperuricemia model treated with allopurinol), and blank group (C57BL/6J mice treated with water). Body weight was measured on the first day, 4th and 8th week. Compared with the first week of the same group, △△p < 0.01. Compared with the 4th week of the same group, #p < 0.05, ##p < 0.01. Compared with the blank group, p < 0.05.
Figure 4
Figure 4
Serum uric acid levels in mice. Compared with the 4th week of the same group, #p < 0.05, ##p < 0.01. Compared with the blank group, p < 0.05, ∗∗p < 0.01. Compared with IB model group, ▲▲p < 0.01.
Figure 5
Figure 5
Clustering tree diagram of intestinal flora OTU in each group mice. The length of branch represents the distance between samples, and the more similar the sample will be, the closer it will be.
Figure 6
Figure 6
Structure and abundance of intestinal flora in the six groups. The colors correspond to the names of different intestinal flora species, and the width of the color bar represents the proportion of relative abundance of the species.
Figure 7
Figure 7
Correlation with flora and uric acid by linear regression line analysis. The strains of intestinal flora were positively correlated with uric acid (R-square = 0.864, F = 3.358, p = 0.027).
Figure 8
Figure 8
Histogram of flora functional distribution in each group. The numbers 1, 2, 3, 4, 5, and 6 refer to IB model group, IB model plus CoTOL group, IB model plus allopurinol group, CoTOL group, allopurinol group, and blank group, respectively. The colors correspond to the different flora function, and the width of the color bar represents the proportion of relative abundance of the species.

Similar articles

Cited by

References

    1. Dehlin M., Jacobsson L., Roddy E. Global epidemiology of gout: prevalence, incidence, treatment patterns and risk factors. Nature Reviews Rheumatology. 2020;16(7):380–390. doi: 10.1038/s41584-020-0441-1. - DOI - PubMed
    1. Xia Y., Wu Q., Wang H., et al. Global, regional and national burden of gout, 1990-2017: a systematic analysis of the Global Burden of Disease Study. Rheumatology. 2020;59(7):1529–1538. doi: 10.1093/rheumatology/kez476. - DOI - PubMed
    1. Fenando A., Widrich J. Gout (podagra) StatPearls. 2020;5
    1. Evans P. L. Obesity, hypertension and diuretic use as risk factors for incident gout: a systematic review and meta-analysis of cohort studies. Arthritis Research & Therapy. 2018;20(1):p. 136. doi: 10.1186/s13075-018-1612-1. - DOI - PMC - PubMed
    1. Maynard J. W. Incident gout in women and association with obesity in the atherosclerosis risk in communities (ARIC) study. The American Journal of Medicine. 2012;125(7) doi: 10.1016/j.amjmed.2011.11.018. - DOI - PMC - PubMed

LinkOut - more resources