

JAG1, Regulated by microRNA-424-3p, Involved in Tumorigenesis and Epithelial-Mesenchymal Transition of High Proliferative Potential-Pituitary Adenomas
- PMID: 33425722
- PMCID: PMC7787033
- DOI: 10.3389/fonc.2020.567021
JAG1, Regulated by microRNA-424-3p, Involved in Tumorigenesis and Epithelial-Mesenchymal Transition of High Proliferative Potential-Pituitary Adenomas
Abstract
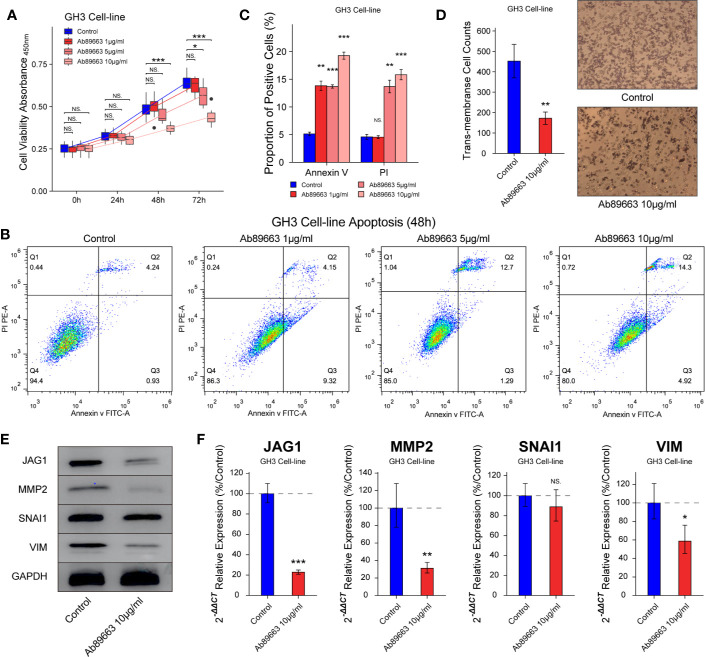
Pituitary adenomas (PAs) are a neoplastic proliferation of anterior pituitary. Signature of Notch pathway relies upon the histopathological type of PAs. The details of Notch pathway that are involved in the migration and invasion of Pas are still unclear. This paper filters and testifies the relation between Notch signaling pathway and the migration/invasion in subtypes of PAs. The diversity of genes and pathways is investigated based on transcriptome data of 60 patients by KEGG pathway analysis and GSEA. A series of functional experiments demonstrate the role of candidate genes by overexpression and antibody blocking in GH3 cell line. Volcano map and GSEA results exhibit the differential and the priority of Jagged1 canonical Notch Ligand (JAG1) in the Notch pathway combined with clinical features. JAG1 is involved in epithelial-mesenchymal transition (EMT) in PAs by correlation analysis of RNA-seq data. Progression-free survival (PFS) of patients with high JAG1 was shorter than patients with low JAG1 according to follow-up data (P = 0.006). Furthermore, overexpression and antibody blocking experiments in GH3 cell line indicate that JAG1 could promote cell proliferation, migration, and G1/S transition. Double luciferase reporter assay gives manifests that JAG1 is the target gene of miR-424-3p, and mimics or inhibitor of miR-424-3p can regulate the level of JAG1 which, in turn, affects cell proliferation and the levels of MMP2 and VIM in GH3 cell line, respectively. Our study delves into the relation between the Notch signaling pathway and cell proliferation and EMT in PAs, providing a potential treatment through targeting JAG1.
Keywords: Jagged1 canonical Notch Ligand; Notch signaling; epithelial–mesenchymal transition; five-tiered prognostic classification of PitNETs; miR-424-3p; pituitary adenoma.
Copyright © 2020 Chen, Li, Feng, Fang, Cheng, Xie, Li, Cheng, Zhang and Gao.
Conflict of interest statement
The authors declare that the research was conducted in the absence of any commercial or financial relationships that could be construed as a potential conflict of interest.
Figures


Similar articles
-
LncRNA UCA1/miR-124 axis modulates TGFβ1-induced epithelial-mesenchymal transition and invasion of tongue cancer cells through JAG1/Notch signaling.J Cell Biochem. 2019 Jun;120(6):10495-10504. doi: 10.1002/jcb.28334. Epub 2019 Jan 11. J Cell Biochem. 2019. PMID: 30635938
-
miR-598 inhibits metastasis in colorectal cancer by suppressing JAG1/Notch2 pathway stimulating EMT.Exp Cell Res. 2017 Mar 1;352(1):104-112. doi: 10.1016/j.yexcr.2017.01.022. Epub 2017 Feb 1. Exp Cell Res. 2017. PMID: 28161537
-
MicroRNA-539 inhibits the progression of Wilms' Tumor through downregulation of JAG1 and Notch1/3.Cancer Biomark. 2019;24(1):125-133. doi: 10.3233/CBM-181972. Cancer Biomark. 2019. PMID: 30530967 Free PMC article.
-
Biomedical engineering approaches for the delivery of JAGGED1 as a potential tissue regenerative therapy.Front Bioeng Biotechnol. 2023 Sep 11;11:1217211. doi: 10.3389/fbioe.2023.1217211. eCollection 2023. Front Bioeng Biotechnol. 2023. PMID: 37781534 Free PMC article. Review.
-
The oncogenic role of Jagged1/Notch signaling in cancer.Biomed Pharmacother. 2020 Sep;129:110416. doi: 10.1016/j.biopha.2020.110416. Epub 2020 Jun 25. Biomed Pharmacother. 2020. PMID: 32593969 Review.
Cited by
-
Epithelial-Mesenchymal Transition in the Resistance to Somatostatin Receptor Ligands in Acromegaly.Front Endocrinol (Lausanne). 2021 Mar 15;12:646210. doi: 10.3389/fendo.2021.646210. eCollection 2021. Front Endocrinol (Lausanne). 2021. PMID: 33790868 Free PMC article.
-
A Novel Small Molecular Inhibitor of DNMT1 Enhances the Antitumor Effect of Radiofrequency Ablation in Lung Squamous Cell Carcinoma Cells.Front Pharmacol. 2022 Mar 23;13:863339. doi: 10.3389/fphar.2022.863339. eCollection 2022. Front Pharmacol. 2022. PMID: 35401185 Free PMC article.
-
Role of miR-424 in the carcinogenesis.Clin Transl Oncol. 2024 Jan;26(1):16-38. doi: 10.1007/s12094-023-03209-2. Epub 2023 May 13. Clin Transl Oncol. 2024. PMID: 37178445 Free PMC article. Review.
-
Emerging Roles of miRNA, lncRNA, circRNA, and Their Cross-Talk in Pituitary Adenoma.Cells. 2022 Sep 19;11(18):2920. doi: 10.3390/cells11182920. Cells. 2022. PMID: 36139495 Free PMC article. Review.
-
Analysis of the Prognostic and Immunological Role of HSPB1 in Pituitary Adenoma: A Potential Target for Therapy.Medicina (Kaunas). 2023 May 5;59(5):885. doi: 10.3390/medicina59050885. Medicina (Kaunas). 2023. PMID: 37241117 Free PMC article.
References
-
- Trouillas J, Roy P, Sturm N, Dantony E, Cortet-Rudelli C, Viennet G, et al. A new prognostic clinicopathological classification of pituitary adenomas: a multicentric case-control study of 410 patients with 8 years post-operative follow-up. Acta Neuropathol (2013) 126:123–35. 10.1007/s00401-013-1084-y - DOI - PubMed
LinkOut - more resources
Full Text Sources
Other Literature Sources
Miscellaneous