

A Prognostic Microenvironment-Related Immune Signature via ESTIMATE (PROMISE Model) Predicts Overall Survival of Patients With Glioma
- PMID: 33425732
- PMCID: PMC7793983
- DOI: 10.3389/fonc.2020.580263
A Prognostic Microenvironment-Related Immune Signature via ESTIMATE (PROMISE Model) Predicts Overall Survival of Patients With Glioma
Abstract
Objective: In the development of immunotherapies in gliomas, the tumor microenvironment (TME) needs to be investigated. We aimed to construct a prognostic microenvironment-related immune signature via ESTIMATE (PROMISE model) for glioma.
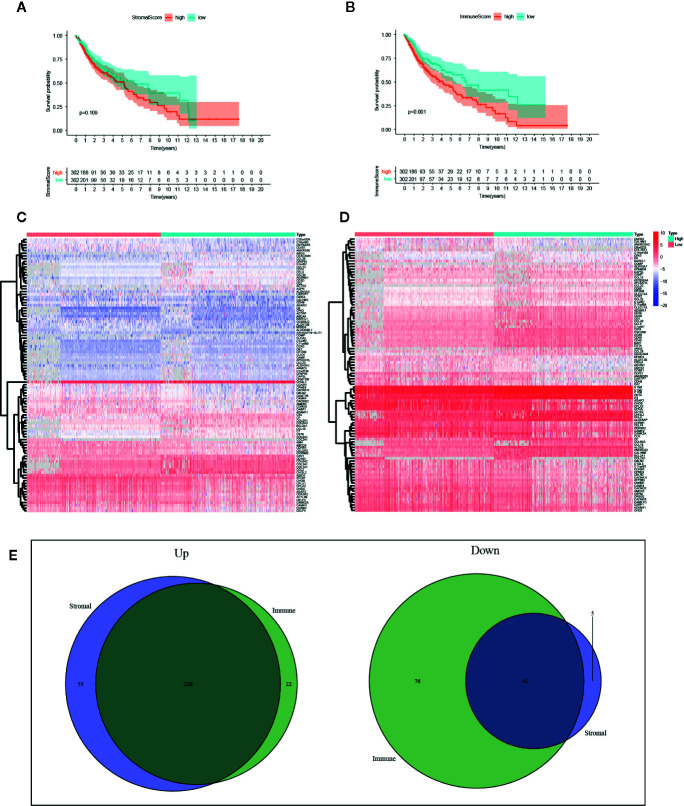
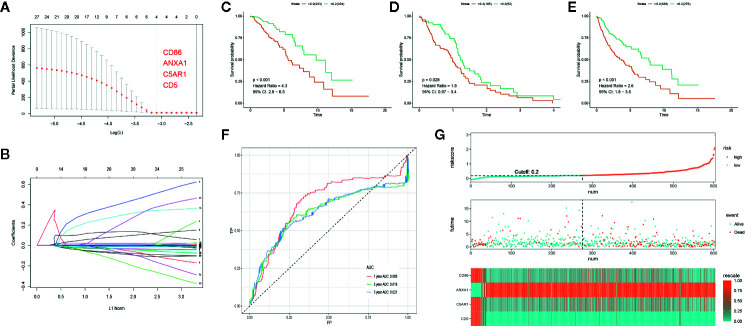
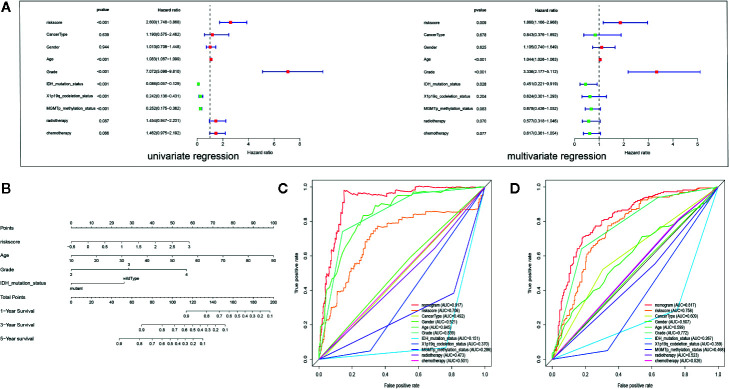
Methods: Stromal score (SS) and immune score (IS) were calculated via ESTIMATE for each glioma sample in the cancer genome atlas (TCGA), and differentially expressed genes (DEGs) were identified between high-score and low-score groups. Prognostic DEGs were selected via univariate Cox regression analysis. Using the lower-grcade glioma (LGG) data set in TCGA, we performed LASSO regression based on the prognostic DEGs and constructed a PROMISE model for glioma. The model was validated with survival analysis and the receiver operating characteristic (ROC) in TCGA glioma data sets (LGG, glioblastoma multiforme [GBM] and LGG+GBM) and Chinese glioma genome atlas (CGGA). A nomogram was developed to predict individual survival chances. Further, we explored the underlying mechanisms using gene set enrichment analysis (GSEA) and Cibersort analysis of tumor-infiltrating immune cells between risk groups as defined by the PROMISE model.
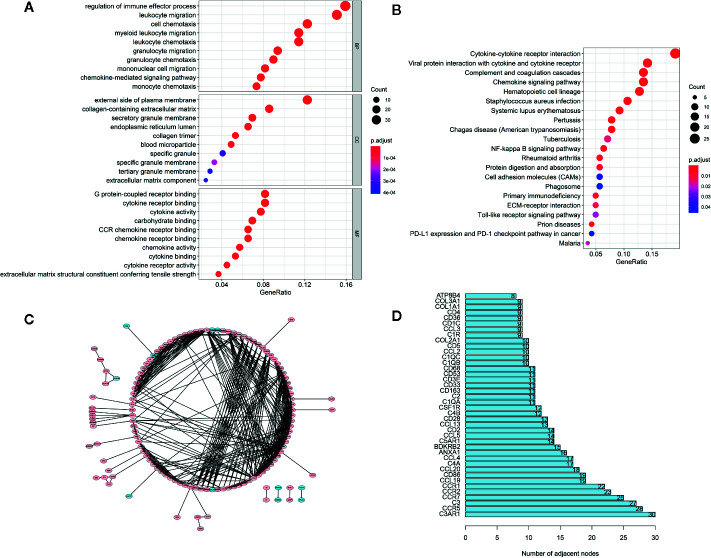
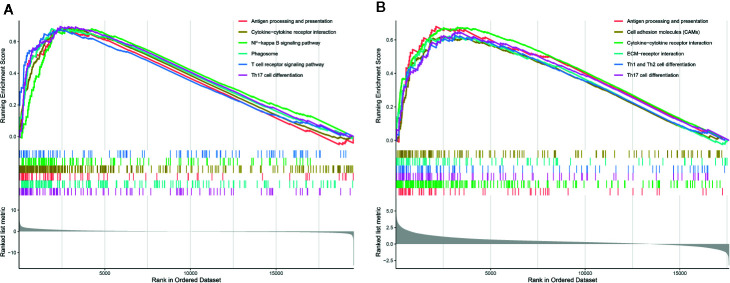
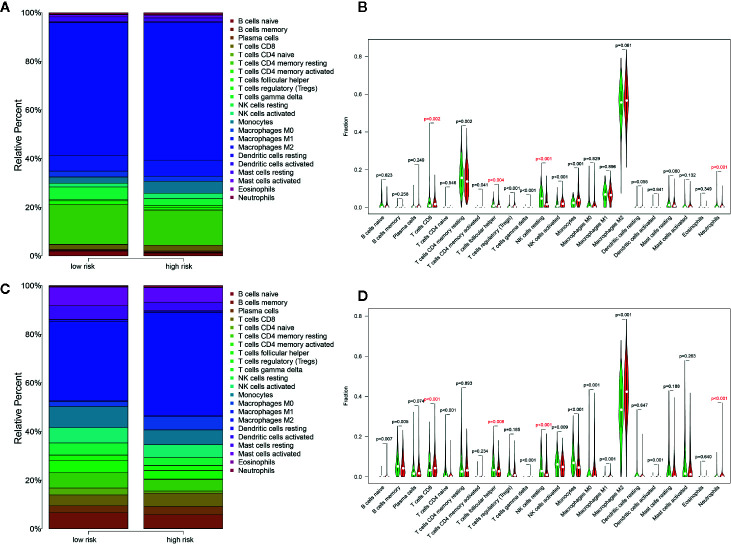
Results: We obtained 220 upregulated DEGs and 42 downregulated DEGs in both high-IS and high-SS groups. The Cox regression highlighted 155 prognostic DEGs, out of which we selected 4 genes (CD86, ANXA1, C5AR1, and CD5) to construct a PROMISE model. The model stratifies glioma patients in TCGA as well as in CGGA with distinct survival outcome (P<0.05, Hazard ratio [HR]>1) and acceptable predictive accuracy (AUCs>0.6). With the nomogram, an individualized survival chance could be predicted intuitively with specific age, tumor grade, Isocitrate dehydrogenase (IDH) status, and the PROMISE risk score. ROC showed significant discrimination with the area under curves (AUCs) of 0.917 and 0.817 in TCGA and CGGA, respectively. GSEA between risk groups in both data sets were significantly enriched in multiple immune-related pathways. The Cibersort analysis highlighted four immune cells, i.e., CD 8 T cells, neutrophils, follicular helper T (Tfh) cells, and Natural killer (NK) cells.
Conclusions: The PROMISE model can further stratify both LGG and GBM patients with distinct survival outcomes.These findings may help further our understanding of TME in gliomas and shed light on immunotherapies.
Keywords: biomarker; glioma; immune signature; prognosis; tumor microenvironment.
Copyright © 2020 Qiu, Li, Cheng, Li, He and Li.
Conflict of interest statement
The authors declare that the research was conducted in the absence of any commercial or financial relationships that could be construed as a potential conflict of interest.
Figures


Similar articles
-
Identification of Iron Metabolism-Related Genes as Prognostic Indicators for Lower-Grade Glioma.Front Oncol. 2021 Sep 9;11:729103. doi: 10.3389/fonc.2021.729103. eCollection 2021. Front Oncol. 2021. PMID: 34568059 Free PMC article.
-
Novel Immune-Related Gene Signature for Risk Stratification and Prognosis of Survival in Lower-Grade Glioma.Front Genet. 2020 Apr 15;11:363. doi: 10.3389/fgene.2020.00363. eCollection 2020. Front Genet. 2020. PMID: 32351547 Free PMC article.
-
Identification of prognostic gene signature associated with microenvironment of lung adenocarcinoma.PeerJ. 2019 Nov 29;7:e8128. doi: 10.7717/peerj.8128. eCollection 2019. PeerJ. 2019. PMID: 31803536 Free PMC article.
-
A new prognostic model for glioblastoma multiforme based on coagulation-related genes.Transl Cancer Res. 2023 Oct 31;12(10):2898-2910. doi: 10.21037/tcr-23-322. Epub 2023 Oct 10. Transl Cancer Res. 2023. PMID: 37969372 Free PMC article.
-
Review: therapeutic approaches for circadian modulation of the glioma microenvironment.Front Oncol. 2023 Dec 20;13:1295030. doi: 10.3389/fonc.2023.1295030. eCollection 2023. Front Oncol. 2023. PMID: 38173841 Free PMC article. Review.
Cited by
-
Editorial: Application of rehabilomics in surgical conditions.Front Surg. 2024 Oct 15;11:1493770. doi: 10.3389/fsurg.2024.1493770. eCollection 2024. Front Surg. 2024. PMID: 39474229 Free PMC article. No abstract available.
-
Establishment of Novel Prostate Cancer Risk Subtypes and A Twelve-Gene Prognostic Model.Front Mol Biosci. 2021 May 28;8:676138. doi: 10.3389/fmolb.2021.676138. eCollection 2021. Front Mol Biosci. 2021. PMID: 34124157 Free PMC article.
-
ANXA1 as a Prognostic and Immune Microenvironmental Marker for Gliomas Based on Transcriptomic Analysis and Experimental Validation.Front Cell Dev Biol. 2021 Aug 4;9:659080. doi: 10.3389/fcell.2021.659080. eCollection 2021. Front Cell Dev Biol. 2021. PMID: 34422796 Free PMC article.
-
Comparative profiling of immune genes improves the prognoses of lower grade gliomas.Cancer Biol Med. 2021 Oct 9;19(4):533-50. doi: 10.20892/j.issn.2095-3941.2021.0173. Cancer Biol Med. 2021. PMID: 34623790 Free PMC article.
-
Integrated Analysis Reveals Prognostic Value and Immune Correlates of CD86 Expression in Lower Grade Glioma.Front Oncol. 2021 Apr 19;11:654350. doi: 10.3389/fonc.2021.654350. eCollection 2021. Front Oncol. 2021. PMID: 33954112 Free PMC article.
References
LinkOut - more resources
Full Text Sources
Research Materials
Miscellaneous