

Three Immune-Associated Subtypes of Diffuse Glioma Differ in Immune Infiltration, Immune Checkpoint Molecules, and Prognosis
- PMID: 33425739
- PMCID: PMC7786360
- DOI: 10.3389/fonc.2020.586019
Three Immune-Associated Subtypes of Diffuse Glioma Differ in Immune Infiltration, Immune Checkpoint Molecules, and Prognosis
Abstract
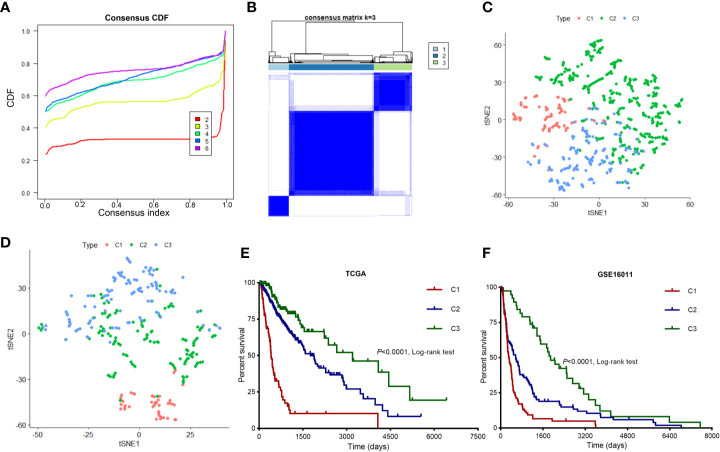
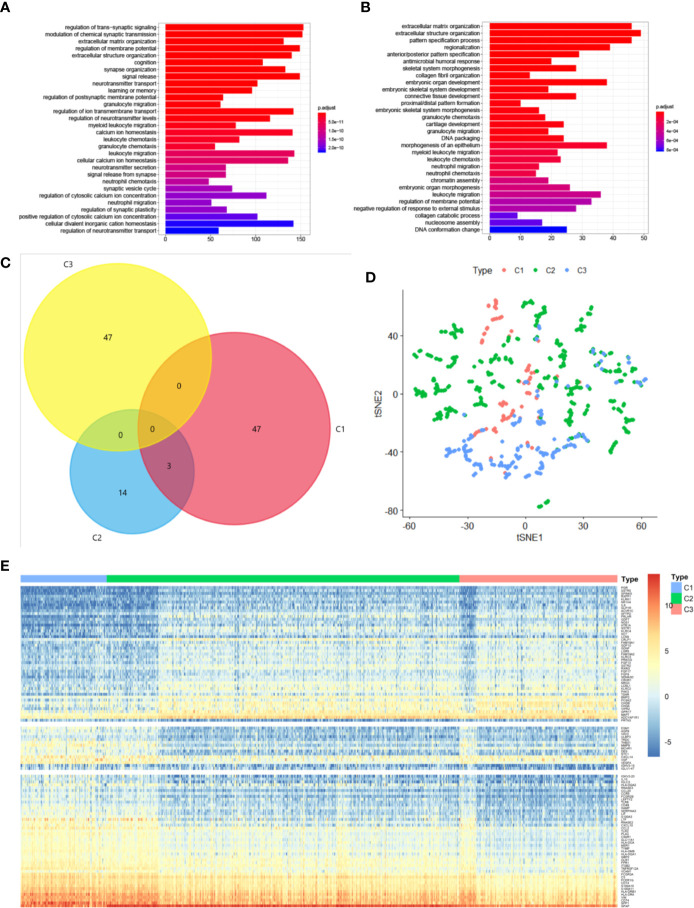
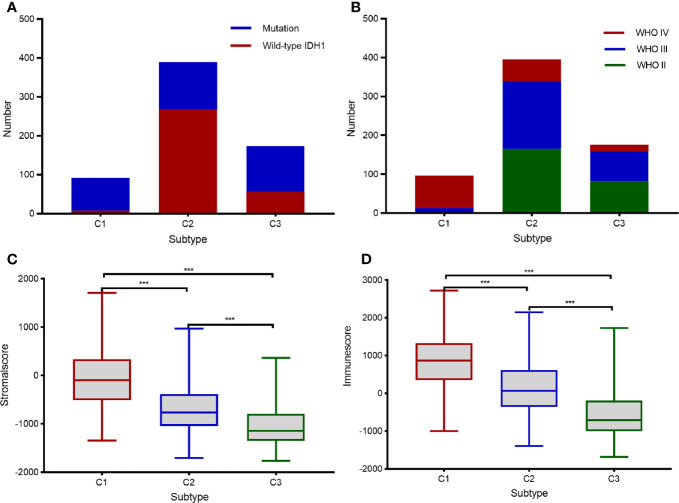
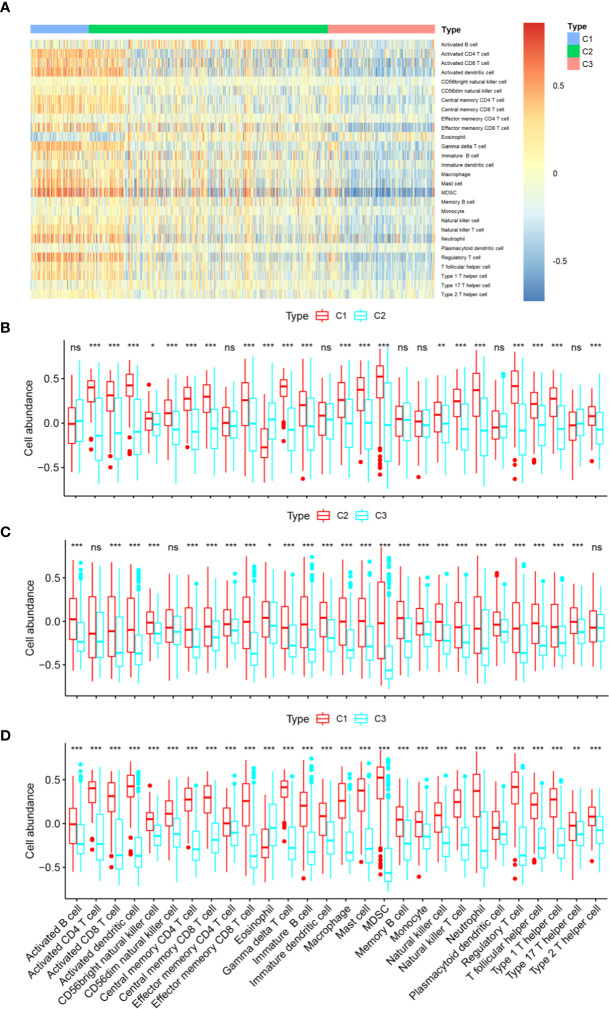
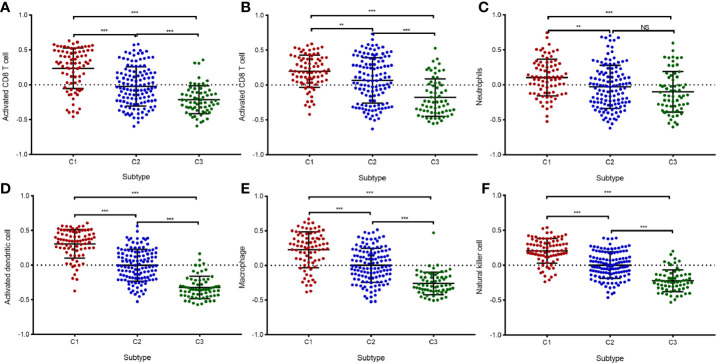
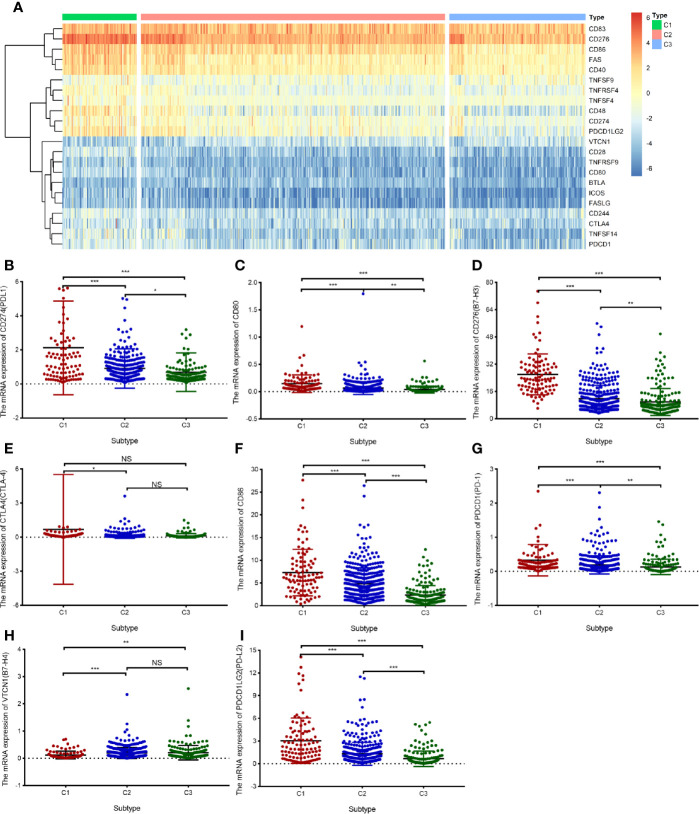
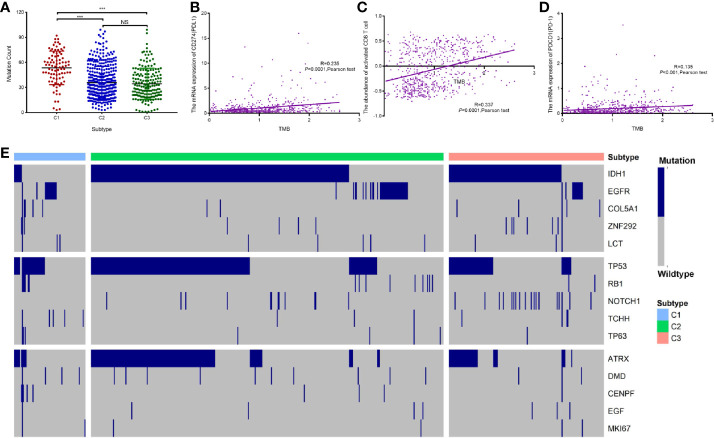
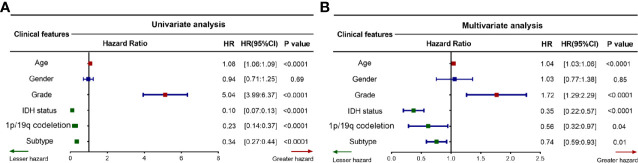
Diffuse glioma is one of the most prevalent malignancies of the brain, with high heterogeneity of tumor-infiltrating immune cells. However, immune-associated subtypes of diffuse glioma have not been determined, nor has the effect of different immune-associated subtypes on disease prognosis and immune infiltration of diffuse glioma patients. We retrieved the expression profiles of immune-related genes from The Cancer Genome Atlas (TCGA) (n = 672) and GSE16011 (n = 268) cohorts and used them to identify subtypes of diffuse glioma via Consensus Cluster Plus analysis. We used the limma, clusterProfiler, ESTIMATE, and survival packages of R for differential analysis, functional enrichment, immune and stromal score evaluation respectively in three subtypes, and performed log-rank tests in immune subtypes of diffuse glioma. The immune-associated features of diffuse glioma in the two cohorts were characterized via bioinformatic analyses of the mRNA expression data of immune-related genes. Three subtypes (C1-3) of diffuse glioma were identified from TCGA data, and were verified using the GSE16011 cohort. We then evaluated their immune characteristics and clinical features. Our mRNA profiling analyses indicated that the different subtypes of diffuse glioma presented differential expression profile of specific genes and signal pathways in the TCGA cohort. Patients with subtype C1, who were mostly diagnosed with grade IV glioma, had poorer outcomes than patients with subtype C2 or C3. Subtype C1 was characterized by a higher degree of immune cell infiltration as estimated by GSVA, and more frequent wildtype IDH1. By contrast, subtype C3 included more grade II and IDH1-mutated glioma, and was associated with more infiltration of CD4+T cells. Most subtype C2 had the features between subtypes C1 and C3. Meanwhile, immune checkpoints and their ligand molecules, including PD1/(PD-L1/PDL2), CTLA4/(CD80/CD86), and B7H3/TLT2, were significantly upregulated in subtype C1 and downregulated in subtype C3. In addition, patients with subtype C1 exhibited more frequent gene mutations. Univariate and multivariate Cox regression analyses revealed that diffuse glioma subtype was an effective, independent, and better prognostic factor. Therefore, we established a novel immune-related classification of diffuse glioma, which provides potential immunotherapy targets for diffuse glioma.
Keywords: Gene Expression Omnibus (GEO); The Cancer Genome Atlas (TCGA); bioinformatic analysis; diffuse glioma; immune checkpoint molecule; immune-associated subtype; tumor immune infiltration.
Copyright © 2020 Zhou, Yan, Liu, Yin, Xu, Cheng, Jiang and Ren.
Conflict of interest statement
The authors declare that the research was conducted in the absence of any commercial or financial relationships that could be construed as a potential conflict of interest.
Figures
Similar articles
-
Two immune-enhanced molecular subtypes differ in inflammation, checkpoint signaling and outcome of advanced head and neck squamous cell carcinoma.Oncoimmunology. 2017 Nov 6;7(2):e1392427. doi: 10.1080/2162402X.2017.1392427. eCollection 2018. Oncoimmunology. 2017. PMID: 29308323 Free PMC article.
-
Identification of three tumor antigens and immune subtypes for mRNA vaccine development in diffuse glioma.Theranostics. 2021 Oct 3;11(20):9775-9790. doi: 10.7150/thno.61677. eCollection 2021. Theranostics. 2021. PMID: 34815785 Free PMC article.
-
Identification of the novel prognostic biomarker, MLLT11, reveals its relationship with immune checkpoint markers in glioma.Front Oncol. 2022 Aug 12;12:889351. doi: 10.3389/fonc.2022.889351. eCollection 2022. Front Oncol. 2022. PMID: 36033495 Free PMC article.
-
A signature-based classification of lung adenocarcinoma that stratifies tumor immunity.Front Oncol. 2023 Jan 12;12:1023833. doi: 10.3389/fonc.2022.1023833. eCollection 2022. Front Oncol. 2023. PMID: 36713530 Free PMC article.
-
The role of immune subtyping in glioma mRNA vaccine development.Immunotherapy. 2023 Sep;15(13):1057-1072. doi: 10.2217/imt-2023-0027. Epub 2023 Jul 11. Immunotherapy. 2023. PMID: 37431617 Review.
Cited by
-
Co-amplified with PDGFRA, IGFBP7 is a prognostic biomarker correlated with the immune infiltrations of glioma.Cancer Med. 2023 Feb;12(4):4951-4967. doi: 10.1002/cam4.5187. Epub 2022 Aug 31. Cancer Med. 2023. PMID: 36043552 Free PMC article.
-
MARCKS is a New Prognostic Biomarker in Hepatocellular Carcinoma.Int J Gen Med. 2023 May 1;16:1603-1619. doi: 10.2147/IJGM.S408651. eCollection 2023. Int J Gen Med. 2023. PMID: 37152272 Free PMC article.
-
Immune classification and identification of prognostic genes for uveal melanoma based on six immune cell signatures.Sci Rep. 2021 Nov 15;11(1):22244. doi: 10.1038/s41598-021-01627-2. Sci Rep. 2021. PMID: 34782661 Free PMC article.
-
Identification of three subtypes of ovarian cancer and construction of prognostic models based on immune-related genes.J Ovarian Res. 2024 Oct 21;17(1):208. doi: 10.1186/s13048-024-01526-w. J Ovarian Res. 2024. PMID: 39434163 Free PMC article.
-
TRP Family Genes Are Differently Expressed and Correlated with Immune Response in Glioma.Brain Sci. 2022 May 19;12(5):662. doi: 10.3390/brainsci12050662. Brain Sci. 2022. PMID: 35625048 Free PMC article.
References
LinkOut - more resources
Full Text Sources
Research Materials
Miscellaneous