Establishing a Reference Dose-Response Calibration Curve for Dicentric Chromosome Aberrations to Assess Accidental Radiation Exposure in Saudi Arabia
- PMID: 33425838
- PMCID: PMC7793750
- DOI: 10.3389/fpubh.2020.599194
Establishing a Reference Dose-Response Calibration Curve for Dicentric Chromosome Aberrations to Assess Accidental Radiation Exposure in Saudi Arabia
Abstract
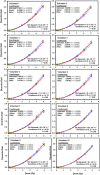
In cases of nuclear and radiological accidents, public health and emergency response need to assess the magnitude of radiation exposure regardless of whether they arise from disaster, negligence, or deliberate act. Here we report the establishment of a national reference dose-response calibration curve (DRCC) for dicentric chromosome (DC), prerequisite to assess radiation doses received in accidental exposures. Peripheral blood samples were collected from 10 volunteers (aged 20-40 years, median = 29 years) of both sexes (three females and seven males). Blood samples, cytogenetic preparation, and analysis followed the International Atomic Energy Agency EPR-Biodosimetry 2011 report. Irradiations were performed using 320 kVp X-rays. Metafer system was used for automated and assisted (elimination of false-positives and inclusion of true-positives) metaphases findings and DC scoring. DC yields were fit to a linear-quadratic model. Results of the assisted DRCC showed some variations among individuals that were not statistically significant (homogeneity test, P = 0.66). There was no effect of age or sex (P > 0.05). To obtain representative national DRCC, data of all volunteers were pooled together and analyzed. The fitted parameters of the radiation-induced DC curve were as follows: Y = 0.0020 (±0.0002) + 0.0369 (±0.0019) *D + 0.0689 (±0.0009) *D2. The high significance of the fitted coefficients (z-test, P < 0.0001), along with the close to 1.0 p-value of the Poisson-based goodness of fit (χ2 = 3.51, degrees of freedom = 7, P = 0.83), indicated excellent fitting with no trend toward lack of fit. The curve was in the middle range of DRCCs published in other populations. The automated DRCC over and under estimated DCs at low (<1 Gy) and high (>2 Gy) doses, respectively, with a significant lack of goodness of fit (P < 0.0001). In conclusion, we have established the reference DRCC for DCs induced by 320 kVp X-rays. There was no effect of age or sex in this cohort of 10 young adults. Although the calibration curve obtained by the automated (unsupervised) scoring misrepresented dicentric yields at low and high doses, it can potentially be useful for triage mode to segregate between false-positive and near 2-Gy exposures from seriously irradiated individuals who require hospitalization.
Keywords: Dicentric Chromosome (DC); Dicentric chromosome assay (DCA); biodosimetry; chromosome aberration; dose-response curve; radiation emergency preparedness; radiation exposure.
Copyright © 2020 Alsbeih, Al-Hadyan, Al-Harbi, Bin Judia and Moftah.
Conflict of interest statement
The authors declare that the research was conducted in the absence of any commercial or financial relationships that could be construed as a potential conflict of interest.
Figures


Similar articles
-
Establishment of ex vivo calibration curve for X-ray induced "dicentric + ring" and micronuclei in human peripheral lymphocytes for biodosimetry during radiological emergencies, and validation with dose blinded samples.Heliyon. 2023 Jun 7;9(6):e17068. doi: 10.1016/j.heliyon.2023.e17068. eCollection 2023 Jun. Heliyon. 2023. PMID: 37484390 Free PMC article.
-
Establishing cytogenetic biodosimetry laboratory in Saudi Arabia and producing preliminary calibration curve of dicentric chromosomes as biomarker for medical dose estimation in response to radiation emergencies.3 Biotech. 2014 Dec;4(6):635-645. doi: 10.1007/s13205-014-0217-x. Epub 2014 Apr 18. 3 Biotech. 2014. PMID: 28324310 Free PMC article.
-
Automated Dicentric Aberration Scoring for Triage Dose Assessment: 60Co Gamma Ray Dose-response at Different Dose Rates.Health Phys. 2020 Jul;119(1):52-58. doi: 10.1097/HP.0000000000001285. Health Phys. 2020. PMID: 32483043
-
Cytogenetic biodosimetry: what it is and how we do it.Hong Kong Med J. 2013 Apr;19(2):168-73. Hong Kong Med J. 2013. PMID: 23535678 Review.
-
Usefulness and limits of biological dosimetry based on cytogenetic methods.Radiat Prot Dosimetry. 2005;115(1-4):448-54. doi: 10.1093/rpd/nci061. Radiat Prot Dosimetry. 2005. PMID: 16381765 Review.
Cited by
-
Development of high-throughput systems for biodosimetry.Radiat Prot Dosimetry. 2023 Sep 18;199(14):1477-1484. doi: 10.1093/rpd/ncad060. Radiat Prot Dosimetry. 2023. PMID: 37721060 Free PMC article.
-
FISH unveils a unified method for multi-marker biodose assessment.Sci Rep. 2025 May 16;15(1):16994. doi: 10.1038/s41598-025-87549-9. Sci Rep. 2025. PMID: 40379733 Free PMC article.
-
Establishment of ex vivo calibration curve for X-ray induced "dicentric + ring" and micronuclei in human peripheral lymphocytes for biodosimetry during radiological emergencies, and validation with dose blinded samples.Heliyon. 2023 Jun 7;9(6):e17068. doi: 10.1016/j.heliyon.2023.e17068. eCollection 2023 Jun. Heliyon. 2023. PMID: 37484390 Free PMC article.
-
High Resolution and Automatable Cytogenetic Biodosimetry Using In Situ Telomere and Centromere Hybridization for the Accurate Detection of DNA Damage: An Overview.Int J Mol Sci. 2023 Mar 16;24(6):5699. doi: 10.3390/ijms24065699. Int J Mol Sci. 2023. PMID: 36982772 Free PMC article. Review.
-
Automated system for establishing standard radiation dose-response curves and dose estimation for the Korean population.Sci Rep. 2025 Mar 27;15(1):10639. doi: 10.1038/s41598-025-94678-8. Sci Rep. 2025. PMID: 40148494 Free PMC article.
References
-
- IAEA School of Radiation Emergency Management Vienna, Austria: International Atomic Energy Agency. (2015). Available online at: https://www.iaea.org/services/education-and-training/school-of-radiation... (accessed June 6, 2020).
-
- González AJ. An international perspective on radiological threats and the need for retrospective biological dosimetry of acute radiation overexposures Radiat Measure. (2007) 42:1053–62. 10.1016/j.radmeas.2007.05.027 - DOI
Publication types
MeSH terms
LinkOut - more resources
Full Text Sources

