

Development and Validation of a Combined Ferroptosis and Immune Prognostic Classifier for Hepatocellular Carcinoma
- PMID: 33425905
- PMCID: PMC7785857
- DOI: 10.3389/fcell.2020.596679
Development and Validation of a Combined Ferroptosis and Immune Prognostic Classifier for Hepatocellular Carcinoma
Abstract
Background: Immunotherapy and sorafenib exert anti-tumor effects via ferroptosis, but reliable biomarkers for the individual treatment and prognosis prediction of hepatocellular carcinoma (HCC) based on the ferroptosis and immune status remain lacking.
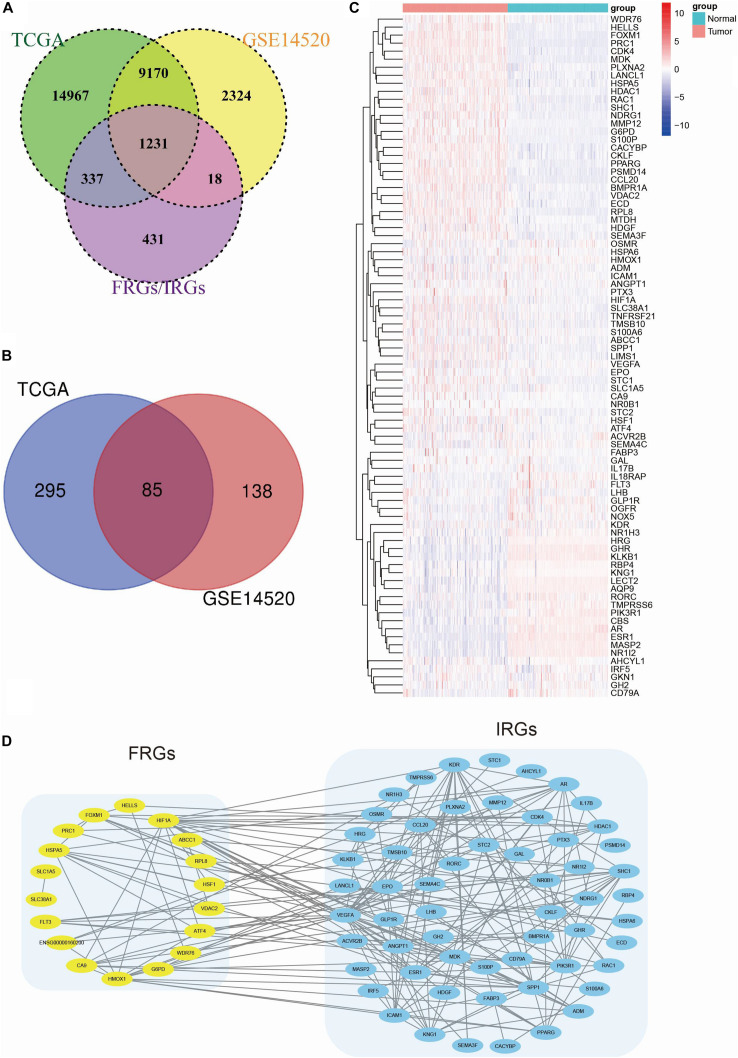
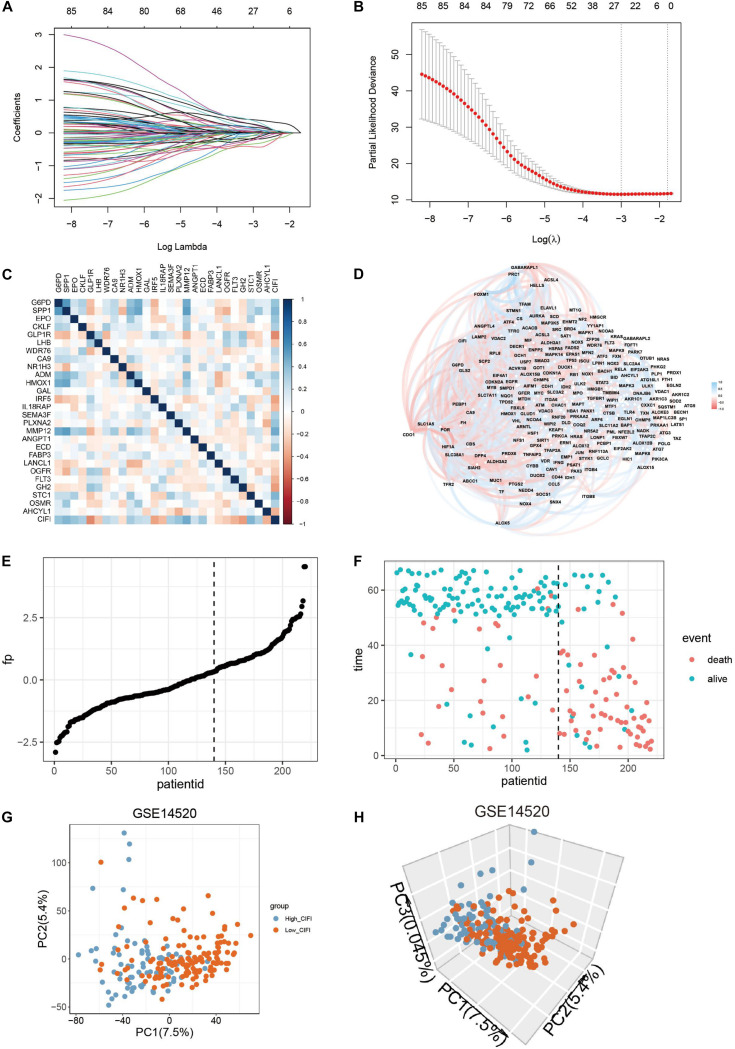
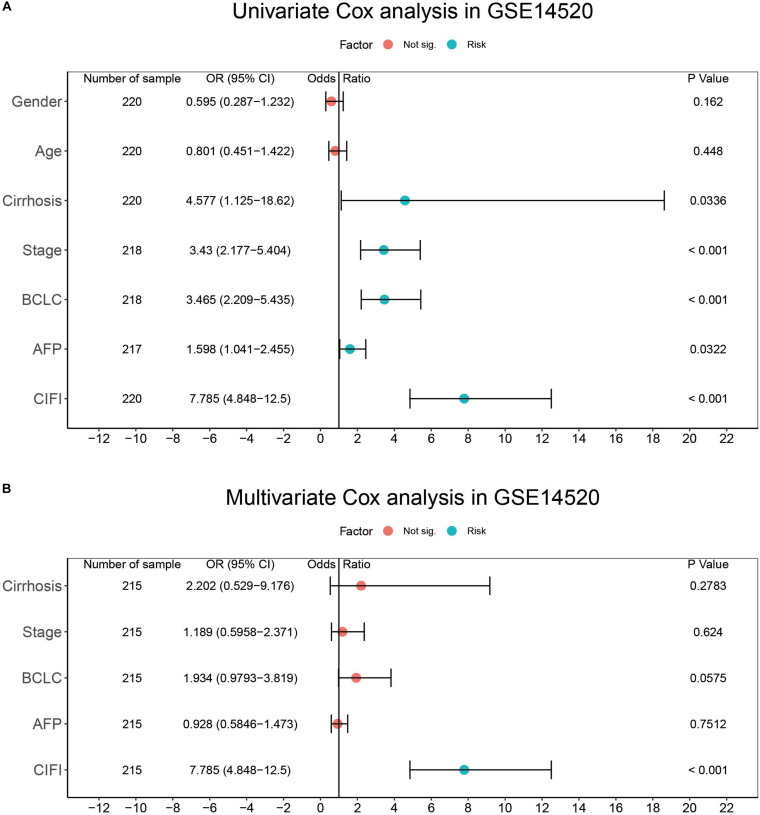
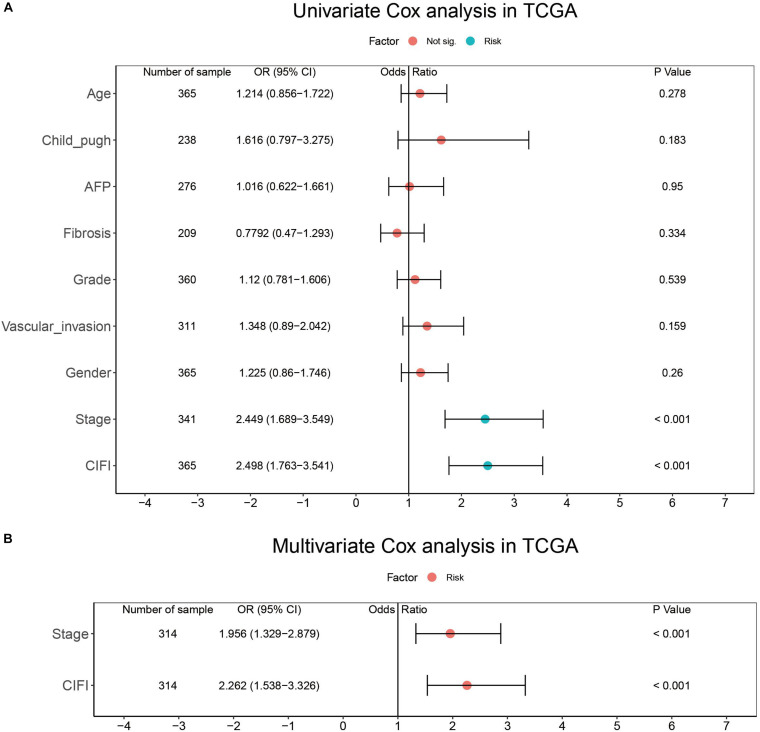
Methods: Ferroptosis-related genes (FRGs) were identified by downloading data from FerrDb and by searching and reading original articles from PubMed. Immune-related genes (IRGs) were downloaded from ImmPort. Prognostic FRGs and IRGs in the GSE14520 (n = 220) and The Cancer Genome Atlas (TCGA, n = 365) datasets were identified. Least absolute shrinkage and selection operator (LASSO) Cox regression and multivariate Cox regression were used for model construction. Ferroptosis expression profiles, the infiltration of immune cells, and the somatic mutation status were analyzed and compared.
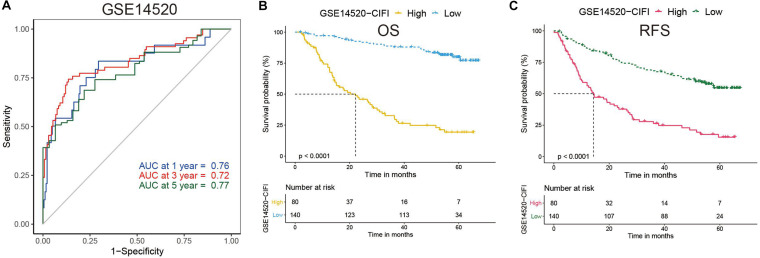
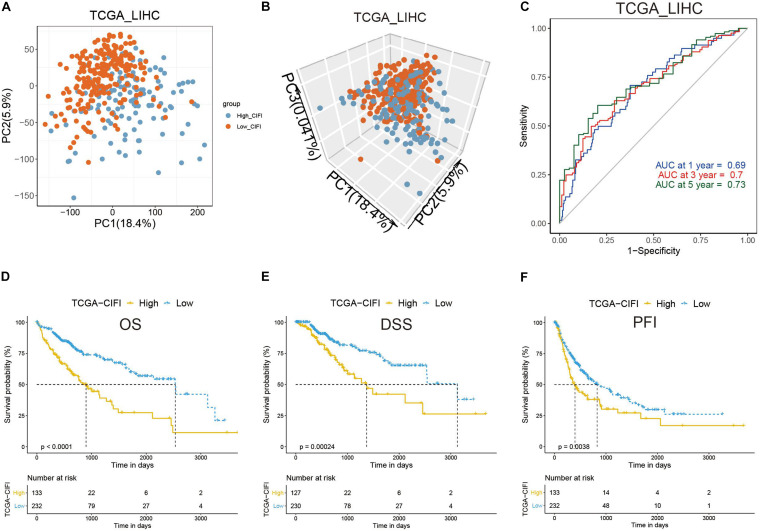
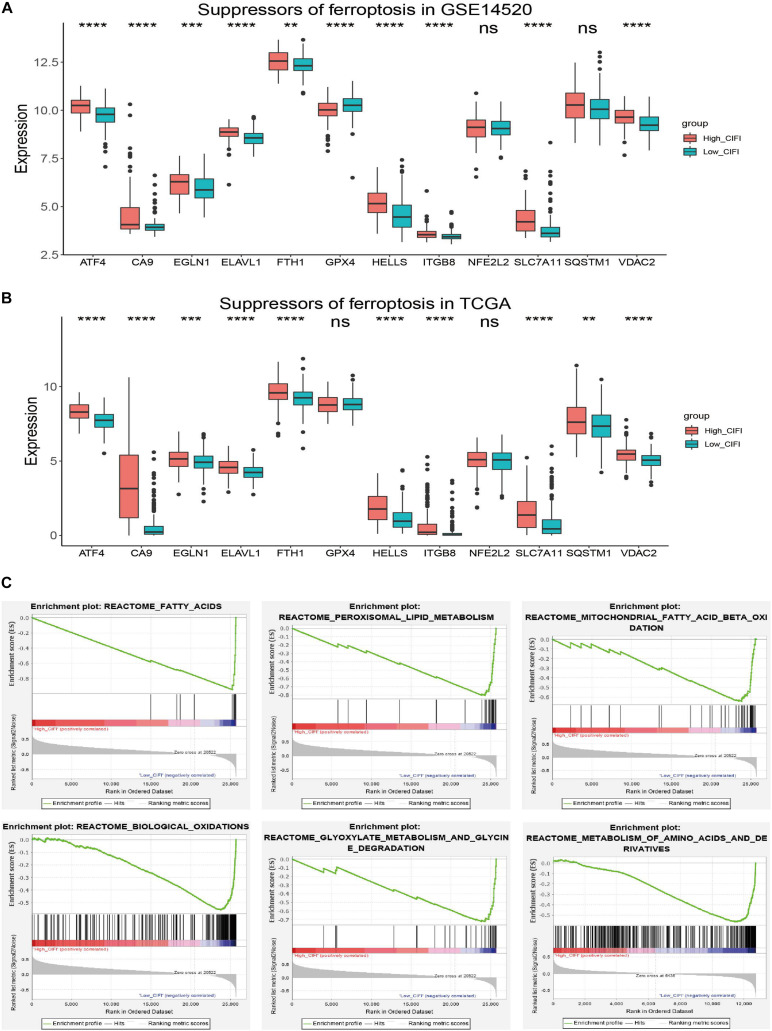
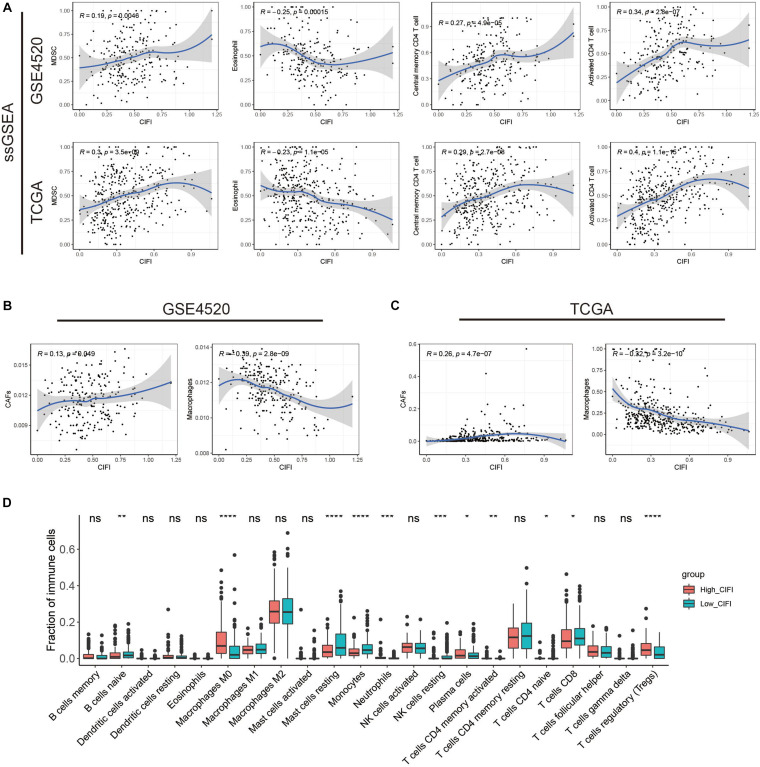
Results: Twenty-seven prognostic ferroptosis- and immune-related signatures were included to construct a comprehensive index of ferroptosis and immune status (CIFI). A subgroup of patients was identified as having a high CIFI value, which was associated with a worse prognosis. This subgroup of patients had significantly up-regulated expressions of many suppressors of ferroptosis and higher fractions of immunosuppressive cells, such as cancer-associated fibroblasts (CAFs) and myeloid-derived suppressor cells (MDSCs). Notably, somatic mutation analysis indicated that high-CIFI patients had higher levels of tumor heterogeneity and higher mutation frequencies of genes like TP53.
Conclusion: In this work, a novel prognostic classifier was developed based on ferroptosis- and IRGs in HCC, and this classifier could be used for prognostic prediction and the selection of patients for immunotherapies and targeted therapies.
Keywords: ferroptosis; hepatocellular carcinoma; immune; personalized therapy; prognosis.
Copyright © 2020 Liu, Zhang, Zhang, Tan, Li and Song.
Conflict of interest statement
The authors declare that the research was conducted in the absence of any commercial or financial relationships that could be construed as a potential conflict of interest.
Figures

Similar articles
-
Development and Validation of a Combined Ferroptosis and Immune Prognostic Model for Melanoma.J Oncol. 2022 Nov 24;2022:1840361. doi: 10.1155/2022/1840361. eCollection 2022. J Oncol. 2022. PMID: 36467505 Free PMC article.
-
Combination of ferroptosis and pyroptosis to construct a prognostic classifier and predict immune landscape, chemotherapeutic efficacy and immunosuppressive molecules in hepatocellular carcinoma.BMC Cancer. 2022 Mar 2;22(1):229. doi: 10.1186/s12885-022-09301-0. BMC Cancer. 2022. PMID: 35236323 Free PMC article.
-
Prognostic prediction and immune infiltration analysis based on ferroptosis and EMT state in hepatocellular carcinoma.Front Immunol. 2022 Dec 15;13:1076045. doi: 10.3389/fimmu.2022.1076045. eCollection 2022. Front Immunol. 2022. PMID: 36591279 Free PMC article.
-
Ferroptosis and cuproptosis prognostic signature for prediction of prognosis, immunotherapy and drug sensitivity in hepatocellular carcinoma: development and validation based on TCGA and ICGC databases.Transl Cancer Res. 2023 Jan 30;12(1):46-64. doi: 10.21037/tcr-22-2203. Epub 2022 Dec 19. Transl Cancer Res. 2023. PMID: 36760376 Free PMC article.
-
Ferroptosis-Associated Classifier and Indicator for Prognostic Prediction in Cutaneous Melanoma.J Oncol. 2021 Oct 28;2021:3658196. doi: 10.1155/2021/3658196. eCollection 2021. J Oncol. 2021. PMID: 34745259 Free PMC article. Review.
Cited by
-
Integrating bioinformatics and experimental validation to unveil disulfidptosis-related lncRNAs as prognostic biomarker and therapeutic target in hepatocellular carcinoma.Cancer Cell Int. 2024 Jan 13;24(1):30. doi: 10.1186/s12935-023-03208-x. Cancer Cell Int. 2024. PMID: 38218909 Free PMC article.
-
Ferroptosis: From Basic Research to Clinical Therapeutics in Hepatocellular Carcinoma.J Clin Transl Hepatol. 2023 Feb 28;11(1):207-218. doi: 10.14218/JCTH.2022.00255. Epub 2022 Aug 31. J Clin Transl Hepatol. 2023. PMID: 36406319 Free PMC article. Review.
-
Ferroptosis-Related Gene Signature Promotes Ovarian Cancer by Influencing Immune Infiltration and Invasion.J Oncol. 2021 May 26;2021:9915312. doi: 10.1155/2021/9915312. eCollection 2021. J Oncol. 2021. PMID: 34135962 Free PMC article.
-
Constructing an immune- and ferroptosis-related lncRNA signature to predict the immune landscape of human bladder cancer.J Clin Lab Anal. 2022 May;36(5):e24389. doi: 10.1002/jcla.24389. Epub 2022 Apr 14. J Clin Lab Anal. 2022. PMID: 35421267 Free PMC article.
-
Construction of a Ferroptosis-Related Long Non-coding RNA Prognostic Signature and Competing Endogenous RNA Network in Lung Adenocarcinoma.Front Cell Dev Biol. 2021 Nov 8;9:751490. doi: 10.3389/fcell.2021.751490. eCollection 2021. Front Cell Dev Biol. 2021. PMID: 34820377 Free PMC article.
References
LinkOut - more resources
Full Text Sources
Research Materials
Miscellaneous