Clinicopathological Significances of Cancer Stem Cell-Associated HHEX Expression in Breast Cancer
- PMID: 33425911
- PMCID: PMC7785851
- DOI: 10.3389/fcell.2020.605744
Clinicopathological Significances of Cancer Stem Cell-Associated HHEX Expression in Breast Cancer
Abstract
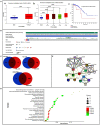
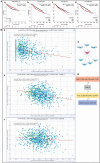
Aberrant expression of the transcription factor hematopoietic ally expressed homeobox/proline-rich homeodomain (HHEX/PRH) is implicated in numerous cancers. However, the association of HHEX with breast cancer (BC) remains unclear. In this study, HHEX mRNA and protein expression were analyzed using the Oncomine, UALCAN, GEPIA, TCGAportal, and HPA databases. We evaluated the effect of HHEX on clinicopathological parameters using Kaplan-Meier plotter, OncoLnc, TCGAportal, PROGgeneV2, and BC-GenExMiner. Western blotting was performed to compare the level of HHEX in breast samples of Tientsin Albino 2 mice, human breast precancerous lesions, benign breast tumors, and BC. The correlation between HHEX and cancer stem cells was investigated using the GEO (GSE52327 and GSE94865) and GEPIA datasets. Networks between HHEX and survival-related gene marker sets and microRNAs were analyzed using GEPIA, StarBase, and Cytoscape. Results of this study showed that HHEX expression in BC was significantly lower than those in breast precancerous lesions and benign breast tumors at both mRNA and protein levels. BC patients with lower HHEX expression had significantly worse overall survival and disease-free survival. Moreover, HHEX significantly affected the clinicopathology of BC. Specifically, low HHEX expression was correlated with the following groups of patients: age ≤51 years, ER-negative or PR-negative patients, HER-2 positive, triple-negative breast cancer, and basal-like BC. Immunohistochemical analysis of the breast samples showed significant differences of HHEX staining index (P < 0.001) among the three groups. To further investigate the mechanism, we determined the intersection of differentially expressed genes related to BC stem cells and those genes after HHEX expression was altered. This led to the identification of four potentially regulated genes-CXL12, BLNK, PAG1, and LPXN. Using StarBase and km-plotter, the negative regulation of HHEX expression and survival trends, including miR-130b, miR-30e, and miR-301b were joined into miRNA-HHEX-mRNA potential regulatory network. The abilities of proliferation, migration and invasion increased in MDA-MB-231 and BT-549 breast cancer cell lines after HHEX down expression and decreased after HHEX overexpression compared them in the control cells. In conclusion, these data suggest that HHEX expression is downregulated in BC and HHEX may regulate the development of BC through the stem cell-related genes.
Keywords: HHEX; breast cancer; cancer stem cells; miRNA-HHEX-mRNA network; prognosis.
Copyright © 2020 Zhang, Zhao, Li, Fu, Zhang, Fu, Zheng and Zhang.
Conflict of interest statement
The authors declare that the research was conducted in the absence of any commercial or financial relationships that could be construed as a potential conflict of interest.
Figures


Similar articles
-
The Haematopoietically-expressed homeobox transcription factor: roles in development, physiology and disease.Front Immunol. 2023 Jun 16;14:1197490. doi: 10.3389/fimmu.2023.1197490. eCollection 2023. Front Immunol. 2023. PMID: 37398663 Free PMC article. Review.
-
Systematic analysis of the expression and prognosis relevance of FBXO family reveals the significance of FBXO1 in human breast cancer.Cancer Cell Int. 2021 Feb 23;21(1):130. doi: 10.1186/s12935-021-01833-y. Cancer Cell Int. 2021. PMID: 33622332 Free PMC article.
-
Identification of Seven Cell Cycle-Related Genes with Unfavorable Prognosis and Construction of their TF-miRNA-mRNA regulatory network in Breast Cancer.J Cancer. 2021 Jan 1;12(3):740-753. doi: 10.7150/jca.48245. eCollection 2021. J Cancer. 2021. PMID: 33403032 Free PMC article.
-
Screening of the novel immune-suppressive biomarkers of TMED family and whether knockdown of TMED2/3/4/9 inhibits cell migration and invasion in breast cancer.Ann Transl Med. 2022 Dec;10(23):1280. doi: 10.21037/atm-22-5444. Ann Transl Med. 2022. PMID: 36618780 Free PMC article.
-
Misregulation of the proline rich homeodomain (PRH/HHEX) protein in cancer cells and its consequences for tumour growth and invasion.Cell Biosci. 2016 Feb 13;6:12. doi: 10.1186/s13578-016-0077-7. eCollection 2016. Cell Biosci. 2016. PMID: 26877867 Free PMC article. Review.
Cited by
-
Comparative Gene Signature of (-)-Oleocanthal Formulation Treatments in Heterogeneous Triple Negative Breast Tumor Models: Oncological Therapeutic Target Insights.Nutrients. 2021 May 18;13(5):1706. doi: 10.3390/nu13051706. Nutrients. 2021. PMID: 34069906 Free PMC article.
-
Genetics of type 2 diabetes mellitus in Indian and Global Population: A Review.Egypt J Med Hum Genet. 2022;23(1):135. doi: 10.1186/s43042-022-00346-1. Epub 2022 Sep 2. Egypt J Med Hum Genet. 2022. PMID: 37192883 Free PMC article. Review.
-
Leupaxin promotes hepatic gluconeogenesis and glucose metabolism by coactivation with hepatic nuclear factor 4α.Mol Metab. 2025 Jan;91:102075. doi: 10.1016/j.molmet.2024.102075. Epub 2024 Nov 26. Mol Metab. 2025. PMID: 39603504 Free PMC article.
-
The Haematopoietically-expressed homeobox transcription factor: roles in development, physiology and disease.Front Immunol. 2023 Jun 16;14:1197490. doi: 10.3389/fimmu.2023.1197490. eCollection 2023. Front Immunol. 2023. PMID: 37398663 Free PMC article. Review.
-
Research progress of nanocarriers for gene therapy targeting abnormal glucose and lipid metabolism in tumors.Drug Deliv. 2021 Dec;28(1):2329-2347. doi: 10.1080/10717544.2021.1995081. Drug Deliv. 2021. PMID: 34730054 Free PMC article. Review.
References
-
- Brickman J. M., Jones C. M., Clements M., Smith J. C., Beddington R. S. (2000). Hex is a transcriptional repressor that contributes to anterior identity and suppresses Spemann organiser function. Development 127, 2303–2315. - PubMed
LinkOut - more resources
Full Text Sources
Research Materials
Miscellaneous

