. 2020 Dec 11:7:581095.
doi: 10.3389/fmolb.2020.581095. eCollection 2020.

Activation of a Mitogen-Activated Protein Kinase Hog1 by DNA Damaging Agent Methyl Methanesulfonate in Yeast

Affiliations

Activation of a Mitogen-Activated Protein Kinase Hog1 by DNA Damaging Agent Methyl Methanesulfonate in Yeast

Shan Huang et al. Front Mol Biosci. .

Abstract

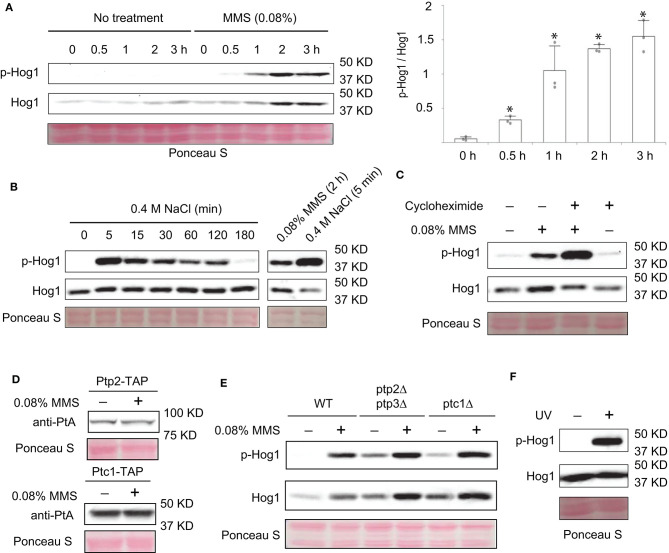
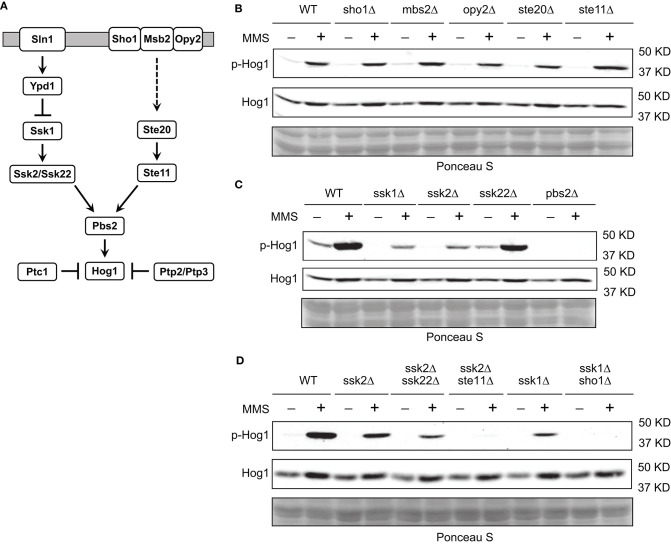
Hog1 is a mitogen-activated protein kinase in yeast that primarily regulates cellular responses to hyperosmolarity stress. In this study, we have examined the potential involvement of Hog1 in mediating cellular responses to DNA damaging agents. We find that treatment of yeast cells with DNA damaging agent methyl methanesulfonate (MMS) induces a marked and prolonged Hog1 activation. Distinct from stressors such as arsenite that activates Hog1 via inhibiting its phosphatases, activation of Hog1 by MMS is phosphatase-independent. Instead, MMS impairs a critical phosphor-relay process that normally keeps Hog1 in an inactive state. Functionally, MMS-activated Hog1 is not translocated to the nucleus to regulate gene expression but rather stays in the cytoplasm and regulates MMS-induced autophagy and cell adaptation to MMS stress. These findings reveal a new role of Hog1 in regulating MMS-induced cellular stress.

Keywords: DNA damage; Hog1; Ypd1; autophagy; mitogen-activated protein kinase; yeast Hog1 activation by DNA damage.


Conflict of interest statement

The authors declare that the research was conducted in the absence of any commercial or financial relationships that could be construed as a potential conflict of interest.

Figures

Figure 1
Figure 1
MMS treatment leads to activation of Hog1. (A) Wild type cells were grown to mid-log phase and treated or not treated with 0.08% MMS for the indicated time. Whole cell extracts were resolved on 8% SDS-PAGE and probed with anti-phospho-p38 (#9212, Cell Signaling Technology) and anti-Hog1 (SC-165978, Santa Cruz). Equal loading was verified with Ponceau S staining. p-Hog1, phosphorylated and activated Hog1. Quantification of immunoblots by densitometry from three independent experiments is shown in the lower panel. The difference between each time point and time 0 was statistically analyzed (*p < 0.050). (B) Wild type cells in mid-log phase were treated with 0.4 M NaCl for the indicated time. Whole cell extracts were analyzed by western blotting with anti-phospho-p38 and anti-Hog1. A direct comparison between cells treated with 0.08% MMS for 2 h and with 0.4 M NaCl for 5 min was shown on the right panel. (C) Wild type cells in mid-log phase were treated with 0.08% MMS, 30 μM cycloheximide, or both for 2 h. Whole cell extracts were analyzed by western blotting with anti-phospho-p38 and anti-Hog1. (D) Cells with TAP-tag on the genomic locus of PTP2 and PTC1 were grown to mid-log phase and treated or not treated with 0.08% of MMS for 2 h. Whole cell extracts were resolved on 8% SDS-PAGE and probed with anti-protein A (anti-PtA, P2921, Sigma-Aldrich). Equal loading was verified with Ponceau S staining. (E) Wild type cells or ptp2Δptp3Δ or ptc1Δ mutants were grown to mid-log phase and treated or not treated with 0.08% of MMS for the indicated time. Whole cell extracts were resolved on 8% SDS-PAGE and probed with anti-phospho-p38 (#9212, Cell Signaling Technology) and anti-Hog1 (SC-165978, Santa Cruz). Equal loading was verified with Ponceau S staining. p-Hog1, phosphorylated and activated Hog1. The data shown are representative of three independent experiments. (F) Wild type cells in mid-log phase were treated or not treated with ultraviolet irradiation for 2 min. Whole cell extracts were analyzed by western blotting using anti-phospho-p38 and anti-Hog1.
Figure 2
Figure 2
Sln1 branch of the HOG pathway is mainly responsible for MMS-induced Hog1 activation. (A) The HOG pathway. See text for details. (B) Wild type cells or isogenic mutants lacking individual components in the Sho1 branch of the HOG pathway were grown to mid-log phase and treated or not treated with 0.08% of MMS for 2 h. Whole cell extracts were resolved on 8% SDS-PAGE and probed with anti-phospho-p38 (#9212, Cell Signaling Technology) and anti-Hog1 (SC-165978, Santa Cruz). Equal loading was verified with Ponceau S staining. p-Hog1, phosphorylated and activated Hog1. The data shown are representative of three independent experiments. (C) The same experiments were carried out as in panel (B) for mutants lacking individual component in the Sln1 branch of the HOG pathway. (D) The same experiments were carried out as in panel (B) for double deletion mutants.
Figure 3
Figure 3
MMS interferes with phosphor-relay in the Sln1/Ypd1/Ssk1 axis. (A) The phosphor-relay in the Sln1/Ypd1/Ssk1 axis. Phosphorylation prevents Ssk1 from interacting and activating its downstream Ssk2/Ssk22. (B) Cells with TAP-tag on the genomic locus of YPD1 were grown to mid-log phase and treated or not treated (Control) with 0.08% of MMS for 2 h. Whole cell extracts were resolved on 8% phos-tag (10 μM) containing or regular SDS-PAGE and probed with anti-protein A (P2921, Sigma-Aldrich). (C) Cells with TAP-tag on the genomic locus of SSK1 were grown to mid-log phase and treated or not treated (Control) with 0.08% of MMS for 2 h. Whole cell extracts were resolved on 8% phos-tag (10 μM) containing or regular SDS-PAGE and probed with anti-protein A (P2921, Sigma-Aldrich).
Figure 4
Figure 4
Hog1 is required for MMS-induced autophagy. (A) Cells with GFP-tag on the genomics locus of HOG1 were grown to mid-log phase, treated or not treated with either 0.4 M NaCl (5 min) or 0.08% of MMS for either 1 or 2 h. The localization of GFP-tagged Hog1 was visualized using confocal microscopy. (B) Wild type cells transformed with plasmids that express STL1-lacZ were grown to mid-log phase, treated with either 0.4 M NaCl or 0.08% MMS for 2 h. Whole cell extracts were resolved on 7% SDS-PAGE and probed with anti-b-galactosidase (Z3781, Promega) and anti-phospho-p38. Equal loading was verified with Ponceau S staining. (C) Wild type cells or hog1Δ mutants transformed with a plasmid that expresses GFP-Atg8 were grown to mid-log phase, treated or not treated with 0.08% MMS for 2 h. Whole cell extracts were resolved on 10% SDS-PAGE and probed with anti-GFP (ab13970, abcam). Equal loading was verified with Ponceau S staining. Quantification of immunoblots by densitometry from three independent experiments is shown in the lower panel. The difference between wild type and the hog1Δ mutants in MMS-treated samples was statistically analyzed (*p < 0.050). (D) The same experiments as described in panel (C) were carried out except that a catalytic inactive Hog1 mutant, i.e., hog1K52R, was used. EV, empty vector. (E) The same experiments as described in panel (C) were carried out except that 2 h of 0.4 M NaCl treatment was used in the left panel and 2 h of 3 mM H2O2 treatment was used in the right panel. (F) Serial diluted wild type cells or hog1Δ mutants were spotted on to either YPD plate or YPD plate containing 0.08% MMS. Plates were incubated at 30°C for 2 days and photographed.

Similar articles

Cited by

References

    1. Adam K., Hunter T. (2018). Histidine kinases and the missing phosphoproteome from prokaryotes to eukaryotes. Lab. Invest. 98, 233–247. 10.1038/labinvest.2017.118 - DOI - PMC - PubMed
    1. Aguilera J., Rodriguez-Vargas S., Prieto J. A. (2005). The HOG MAP kinase pathway is required for the induction of methylglyoxal-responsive genes and determines methylglyoxal resistance in Saccharomyces cerevisiae. Mol. Microbiol. 56, 228–239. 10.1111/j.1365-2958.2005.04533.x - DOI - PubMed
    1. Azad G. K., Singh V., Thakare M. J., Baranwal S., Tomar R. S. (2014). Mitogen-activated protein kinase Hog1 is activated in response to curcumin exposure in the budding yeast Saccharomyces cerevisiae. BMC Microbiol. 14, :317. 10.1186/s12866-014-0317-0 - DOI - PMC - PubMed
    1. Backues S. K., Lynch-Day M. A., Klionsky D. J. (2012). The Ume6-Sin3-Rpd3 complex regulates ATG8 transcription to control autophagosome size. Autophagy 8, 1835–1836. 10.4161/auto.21845 - DOI - PMC - PubMed
    1. Beranek D. T. (1990). Distribution of methyl and ethyl adducts following alkylation with monofunctional alkylating agents. Mutat. Res. 231, 11–30. 10.1016/0027-5107(90)90173-2 - DOI - PubMed

LinkOut - more resources