. 2020 Dec 14:7:599059.
doi: 10.3389/fmolb.2020.599059. eCollection 2020.

Hierarchical Graph Representation of Pharmacophore Models

Affiliations

Hierarchical Graph Representation of Pharmacophore Models

Garon Arthur et al. Front Mol Biosci. .

Abstract

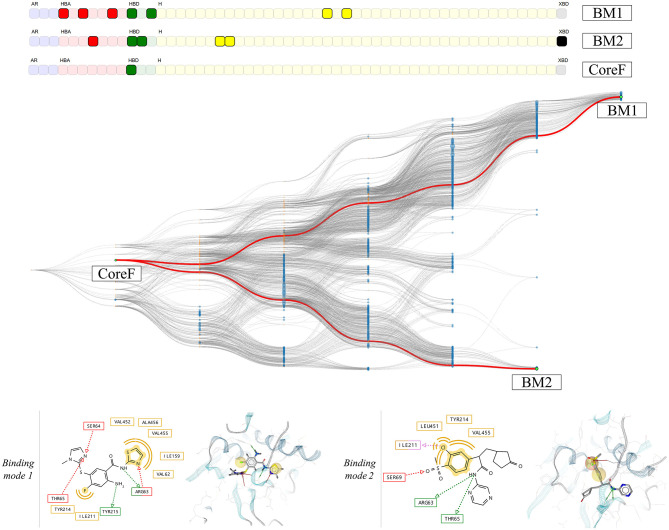
For the investigation of protein-ligand interaction patterns, the current accessibility of a wide variety of sampling methods allows quick access to large-scale data. The main example is the intensive use of molecular dynamics simulations applied to crystallographic structures which provide dynamic information on the binding interactions in protein-ligand complexes. Chemical feature interaction based pharmacophore models extracted from these simulations, were recently used with consensus scoring approaches to identify potentially active molecules. While this approach is rapid and can be fully automated for virtual screening, additional relevant information from such simulations is still opaque and so far the full potential has not been entirely exploited. To address these aspects, we developed the hierarchical graph representation of pharmacophore models (HGPM). This single graph representation enables an intuitive observation of numerous pharmacophore models from long MD trajectories and further emphasizes their relationship and feature hierarchy. The resulting interactive depiction provides an easy-to-apprehend tool for the selection of sets of pharmacophores as well as visual support for analysis of pharmacophore feature composition and virtual screening results. Furthermore, the representation can be adapted to include information involving interactions between the same protein and multiple different ligands. Herein, we describe the generation, visualization and use of HGPMs generated from MD simulations of two x-ray crystallographic derived structures of the human glucokinase protein in complex with allosteric activators. The results demonstrate that a large number of pharmacophores and their relationships can be visualized in an interactive, efficient manner, unique binding modes identified and a combination of models derived from long MD simulations can be strategically prioritized for VS campaigns.

Keywords: clustering; hierarchical graph representation; human glucokinase; molecular dynamic (MD) simulation; pharmacophore modeling; protein ligand binding; protein structure; virtual screening.


Conflict of interest statement

BS and IG are employees of the company Inte:Ligand Software-Entwicklungs und Consulting GmbH, Vienna, Austria. TI and DP are employees of Institut de Recherches Servier (IdRS), Croissy-sur-Seine, France. The herein presented work is the result of a joint research project funded by the aforementioned companies. The remaining authors declare that the research was conducted in the absence of any commercial or financial relationships that could be construed as a potential conflict of interest.

Figures

Figure 1
Figure 1
Generation of the feature vectors and their node representation from an initial set of 5 pharmacophore models. The set of pharmacophore models was converted into a corresponding set of feature vectors by first identifying all encountered unique features. Then the feature vector elements are initialized with 1 or 0 depending on the presence or absence of the corresponding unique feature in the pharmacophore model. A filtering step is done in order to remove duplicates with identical feature vectors. Finally, the graph nodes are created for each unique feature vector and the corresponding pharmacophore models and appearance count values are stored. The pharmacophore model features are: yellow spheres (hydrophobic), red and green arrows (hydrogen-bond acceptors and donors, respectively). The corresponding vector features are colored yellow, red, and green accordingly.
Figure 2
Figure 2
Hierarchical linkage of the graph nodes. Starting from 3 “Observed” nodes in blue, the stored feature vectors are tested for subset/superset relations, represented as blue dotted ellipses. Edges are then created if the relation is found. In the case that two nodes do not depict this relation, represented as an orange ellipse, a new node is created and linked to them. The appearance count for this “Artificial” node is set to 0 and its color is changed to orange. The pharmacophore model features are: yellow spheres (hydrophobic), red and green arrows (hydrogen-bond acceptors and donors, respectively). The corresponding vector features are colored yellow, red, and green accordingly.
Figure 3
Figure 3
Visualization of the Hierarchical graph representation of pharmacophores models derived from a molecular dynamics simulation of human glucokinase in complex with an activator (PDB code: 1v4s). The feature vector is represented on the top of the graph and each box represents a unique pharmacophore feature. The color of the boxes indicates the type of the corresponding feature: yellow (hydrophobic), red and green (hydrogen-bond acceptors and donors, respectively), and blue (aromatic). The hierarchical graph below the feature vector represents all pharmacophore models observed during the simulation. Nodes are linked by hierarchical relations and their color denotes their origin: blue (“Observed” pharmacophore models), or orange (“Artificial” models only composed of a subset of features from the “Observed” pharmacophores). The graph is interactive, nodes can be selected to depict all related pharmacophore models, as shown with the selection of node 1. When two nodes are selected, the node that depicts the pharmacophore feature intersection set is also highlighted (Node 3), as depicted with the selection of Nodes 1 and 2. For each node, the associated pharmacophore model can be easily retrieved.
Figure 4
Figure 4
2D- and 3D-depictions of co-crystallized ligands and their putative interactions with human glucokinase derived from x-ray structures (PDB codes: 1v4s and 4no7) using LigandScout 4.4. Hydrophobic, hydrogen-bond donor and acceptor interactions are displayed in yellow (spheres), red and green (arrows), respectively.
Figure 5
Figure 5
Venn diagrams showing the unique pharmacophore feature similarities between the MD simulation runs performed for the 1v4s and 4no7 systems, respectively. The pharmacophore models considered for the sampling of the unique features were filtered based on an appearance count criteria, set to 2 for the diagrams on the left and 10 on the right.
Figure 6
Figure 6
Pie charts of the unique pharmacophore feature composition of the feature vectors generated from all 3 MD simulations, based on the applied appearance count filtering criterion for both the 1v4s and 4no7 systems. Hydrophobic interactions are colored yellow, aromatic interactions blue, hydrogen bond donors green, hydrogen bond acceptors red and the halogen bond donors gray.
Figure 7
Figure 7
The HGPMs based on the 3 MD simulation runs of the 1v4s system is shown on the top, and for the 4no7 system on the bottom. The nodes matching the pharmacophore models obtained from the PDB structure, the models with the highest frequency of appearance and with the highest count of common features between the crystallographic structures of the systems are highlighted in green and labeled HF and CF, respectively. The feature vectors of the highlighted models are shown above of the corresponding hierarchical graphs.
Figure 8
Figure 8
The hierarchical graph of pharmacophore models derived from human glucokinase PDB codes of the 1v4s system is shown on the top, and of the 4no7 system on the bottom. The nodes are colored according to their AUC values at 10% of the database molecules. The greener the node, the closer is its AUC value to 1, and the redder the closer to 0. Nodes with “Artificial” pharmacophore models are colored gray. The nodes corresponding to the pharmacophore models obtained from the PDB structure, from the highest frequency of appearance and with the two common features between the systems are labeled accordingly. Associated feature vectors are shown above the corresponding graphs.
Figure 9
Figure 9
HGPM obtained from the MD simulation runs of both the 1v4s and 4no7 system. The nodes are colored based on the system they were derived from: cyan for 1v4s and orange for 4no7. The nodes matching the pharmacophore models obtained from the PDB structures, the custom selection and the node with the two observed common features of the systems are labeled and highlighted in green. The feature vector is displayed on the top of the graph.
Figure 10
Figure 10
HGPM obtained from the MD simulation runs human glucokinase starting from both the 1v4s and 4no7 systems. The nodes BM1 and BM2 were selected to show examples of different observed binding modes. 2D and 3D depictions of the corresponding pharmacophore models are shown below the graph.

References

    1. Beck T., Miller B. G. (2013). Structural basis for regulation of human glucokinase by glucokinase regulatory protein. Biochemistry 52, 6232–6239. 10.1021/bi400838t - DOI - PMC - PubMed
    1. Bell G. I., Polonsky K. S. (2001). Diabetes mellitus and genetically programmed defects in β-cell function. Nature 414, 788–791. 10.1038/414788a - DOI - PubMed
    1. Berman H. M. (2000). The protein data bank. Nucl. Acids Res. 28, 235–242. 10.1093/nar/28.1.235 - DOI - PMC - PubMed
    1. Berthold M. R., Cebron N., Dill F., Fatta G. D., Gabriel T. R., Georg F., et al. (2009). Knime: The Konstanz Information Miner. 4.
    1. Boehr D. D., Nussinov R., Wright P. E. (2009). The role of dynamic conformational ensembles in biomolecular recognition. Nat. Chem. Biol. 5, 789–796. 10.1038/nchembio.232 - DOI - PMC - PubMed

LinkOut - more resources