. 2020 Dec 28:2020:8895003.
doi: 10.1155/2020/8895003. eCollection 2020.

Knockdown of the Long Noncoding RNA LUCAT1 Inhibits High-Glucose-Induced Epithelial-Mesenchymal Transition through the miR-199a-5p-ZEB1 Axis in Human Renal Tubular Epithelial Cells

Affiliations

Knockdown of the Long Noncoding RNA LUCAT1 Inhibits High-Glucose-Induced Epithelial-Mesenchymal Transition through the miR-199a-5p-ZEB1 Axis in Human Renal Tubular Epithelial Cells

Li-Cai Zhang et al. Biomed Res Int. .

Abstract

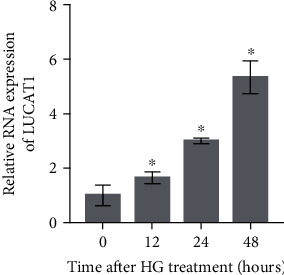
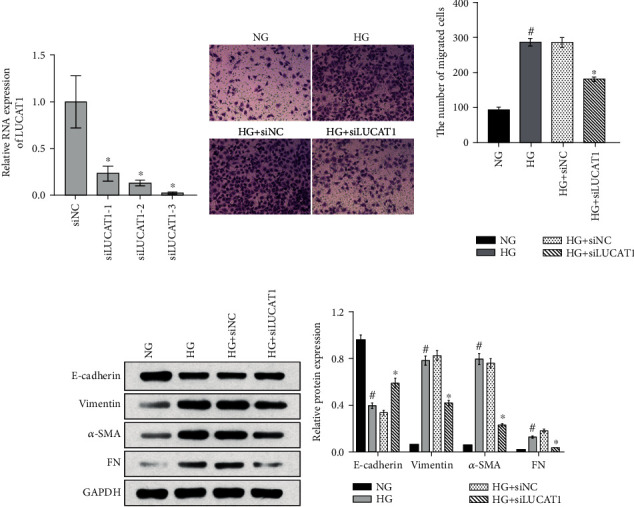
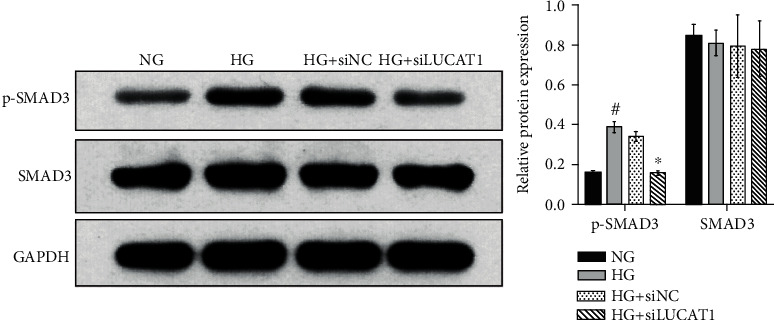
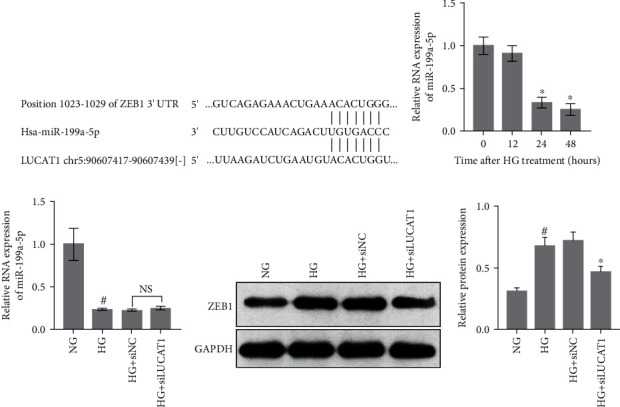
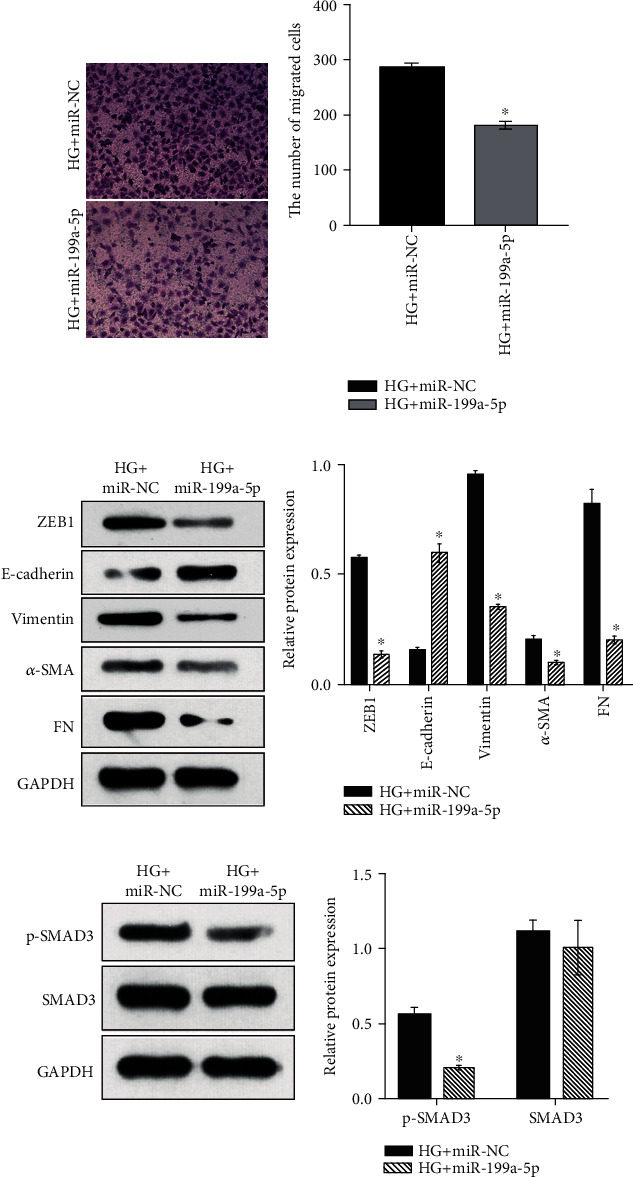
Renal fibrosis, the leading cause of end-stage renal disease and in which epithelial-mesenchymal transition (EMT) plays a central role, has a complex pathogenesis that is not fully understood. Therefore, we investigated the role of the long noncoding RNA LUCAT1 in the EMT of renal tubular epithelial cells under high-glucose (HG) conditions and the underlying mechanism involved. In this study, we established HG and normal glucose groups of HK-2 cells by treating HK-2 cells 30.0 or 5.5 mmol/L glucose, respectively. To investigate the roles of LUCAT1 and miR-199a-5p in HG-induced EMT, we transfected the HG group with negative control small interfering RNA (siRNA), siRNA targeting LUCAT1, negative control microRNA, or an miR-199a-5p mimic. The results of the quantitative reverse transcription PCR indicated that the LUCAT1 level in the HG group was increased, whereas the miR-199a-5p level was decreased. The EMT in the cells was induced by treatment with HG but was weakened by LUCAT1 knockdown or miR-199a-5p overexpression, which both also inhibited the HG-induced phosphorylation of SMAD3. Moreover, LUCAT1 and ZEB1 mRNA comprised the same microRNA response elements of miR-199a-5p. LUCAT1 knockdown had no effect on the miR-199a-5p level but decreased the HG-induced upregulation of ZEB1. In conclusion, HG conditions induced the upregulation of LUCAT1, and LUCAT1 knockdown inhibited the EMT in HG-treated HK-2 cells. LUCAT1 likely promotes HG-induced EMT through ZEB1 by sponging miR-199a-5p.


Conflict of interest statement

The authors do not have any conflicts of interest to declare.

Figures

Figure 1
Figure 1
Expression levels of the long noncoding RNA LUCAT1 in high-glucose- (HG-) treated HK-2 cells measured using quantitative reverse transcription PCR. P < 0.05, compared with the expression level at 0 h.
Figure 2
Figure 2
Knockdown of LUCAT1 inhibits the epithelial-mesenchymal transition (EMT) of high-glucose- (HG-) treated HK-2 cells. (a) LUCAT1 level in HK-2 cells transfected with negative control small interfering RNA (siRNA) (siNC) or three siRNAs targeting LUCAT1 (siLUCAT1; labeled as siLUCAT1-1, siLUCAT1-2, and siLUCAT1-3, respectively). (b, c) Migration capability (b) and expression levels of EMT-related proteins (c) of cells in the normal glucose group (NG, treated with 5.5 mmol/L glucose), high-glucose group (HG, treated with 30 mmol/L glucose), HG+siNC group (transfected with siNC and treated with 30 mmol/L glucose), and HG+siLUCAT1 group (transfected with siLUCAT1 and treated with 30 mmol/L glucose). (b) Left: microphotographs of cells in the Transwell assay; right: a bar graph of the average number of migrated cells. (c) Left: a scanned image of the western blot; right: a bar graph of relative protein levels. The relative protein levels were calculated according to the integrated optical density (IOD) of each band on the X-ray film using the following formula: relative protein level = IOD of the target protein/IOD of GAPDH.
Figure 3
Figure 3
Knockdown of LUCAT1 inhibits the phosphorylation of SMAD3. HK-2 cells were divided into the normal glucose group (NG, treated with 5.5 mmol/L glucose), high-glucose group (HG, treated with 30 mmol/L glucose), HG+siNC group (transfected with siNC and treated with 30 mmol/L glucose), and HG+siLUCAT1 group (transfected with siLUCAT1 and treated with 30 mmol/L glucose). Left: a scanned image of the western blot; right: a bar graph of relative protein levels. The relative protein level was calculated according to the integrated optical density (IOD) of each band on the X-ray film using the following formula: relative protein level = IOD of the target protein/IOD of GAPDH.
Figure 4
Figure 4
The miR-199a-5p–ZEB1 axis is a downstream target of LUCAT1. (a) Binding sites of miR-199a-5p on LUCAT1 and ZEB1 mRNA. (b) Measurement of the miR-199a-5p levels in high-glucose- (HG-) treated HK-2 cells by using quantitative reverse transcription PCR. (c, d) miR-199a-5p and ZEB1 levels in the normal glucose group (NG, treated with 5.5 mmol/L glucose), high-glucose group (HG, treated with 30 mmol/L glucose), HG+siNC group (transfected with siNC and treated with 30 mmol/L glucose), and HG+siLUCAT1 group (transfected with siLUCAT1 and treated with 30 mmol/L glucose). (d) Left: a scanned image of the western blot; right: a bar graph of the relative protein levels. The relative protein level was calculated according to the integrated optical density (IOD) of each band on the X-ray film using the following formula: relative protein level = IOD of ZEB1/IOD of GAPDH.
Figure 5
Figure 5
miR-199a-5p overexpression inhibits both the epithelial-mesenchymal transition (EMT) and the phosphorylation of SMAD3 in high-glucose- (HG-) treated HK-2 cells. Migration capability (a), expression level of EMT-related proteins (b), and level of phosphorylated SMAD3 (c) of cells in the HG+miR-NC group (transfected with miR-NC and treated with 30 mmol/L glucose) and HG+miR-199a-5p group (transfected with miR-199a-5p mimic and treated with 30 mmol/L glucose). (a) Left: microphotographs of the cells in the Transwell assay; right: a bar graph of the average number of migrated cells. In panels (b) and (c), the scanned images of the western blots are on the left, and the bar graphs of relative protein levels are on the right. The relative protein level was calculated according to the integrated optical density (IOD) of each band on the X-ray film using the following formula: relative protein level = IOD of the target protein/IOD of GAPDH.

References

    1. Duffield J. S. Cellular and molecular mechanisms in kidney fibrosis. The Journal of Clinical Investigation. 2014;124(6):2299–2306. doi: 10.1172/JCI72267. - DOI - PMC - PubMed
    1. Djudjaj S., Boor P. Cellular and molecular mechanisms of kidney fibrosis. Molecular Aspects of Medicine. 2019;65:16–36. doi: 10.1016/j.mam.2018.06.002. - DOI - PubMed
    1. Loeffler I., Wolf G. Epithelial-to-mesenchymal transition in diabetic nephropathy: fact or fiction? Cell. 2015;4(4):631–652. doi: 10.3390/cells4040631. - DOI - PMC - PubMed
    1. Wang X., Zhang J., Liu X., Wei B., Zhan L. Long noncoding RNAs in endometriosis: biological functions, expressions, and mechanisms. Journal of Cellular Physiology. 2021;236(1):6–14. doi: 10.1002/jcp.29847. - DOI - PubMed
    1. Grixti J. M., Ayers D. Long noncoding RNAs and their link to cancer. Non-Coding RNA Research. 2020;5(2):77–82. doi: 10.1016/j.ncrna.2020.04.003. - DOI - PMC - PubMed

MeSH terms

LinkOut - more resources