. 2020 Dec 16;5(12):1163-1177.
doi: 10.1016/j.jacbts.2020.10.001. eCollection 2020 Dec.

Metabolomic Signature of Human Aortic Valve Stenosis

Affiliations

Metabolomic Signature of Human Aortic Valve Stenosis

Arun Surendran et al. JACC Basic Transl Sci. .

Abstract

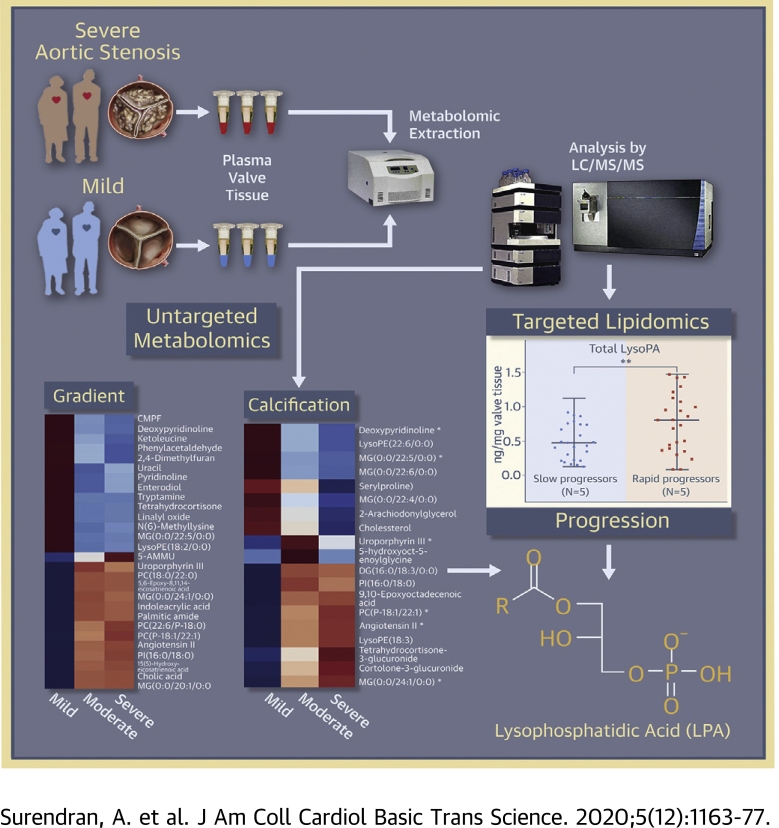
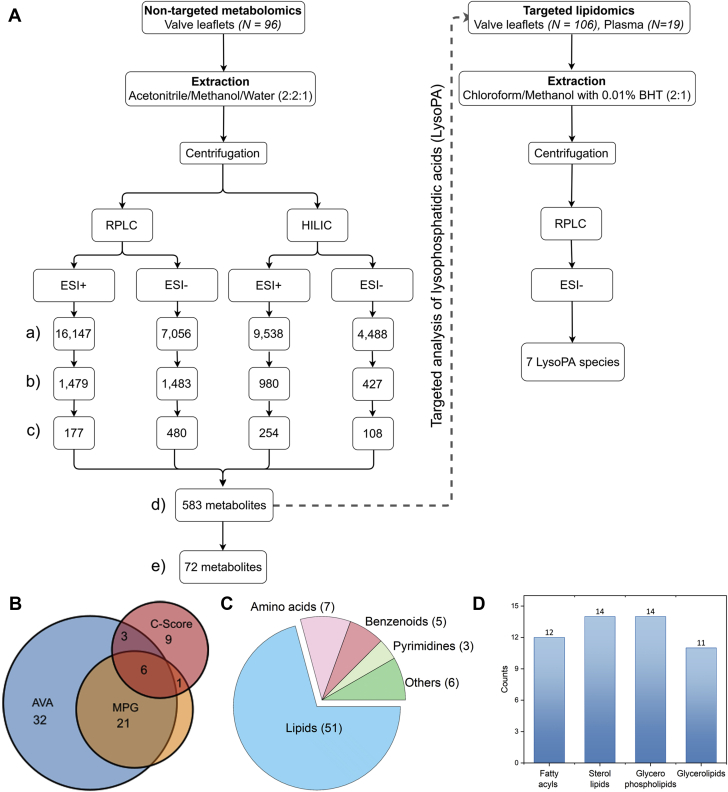
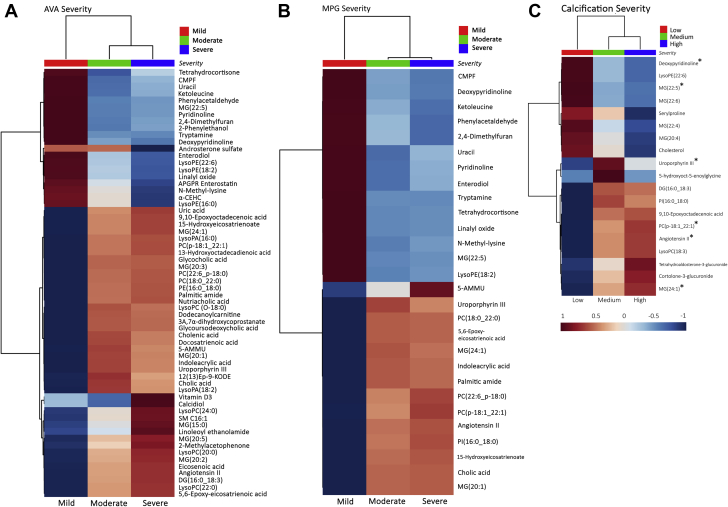
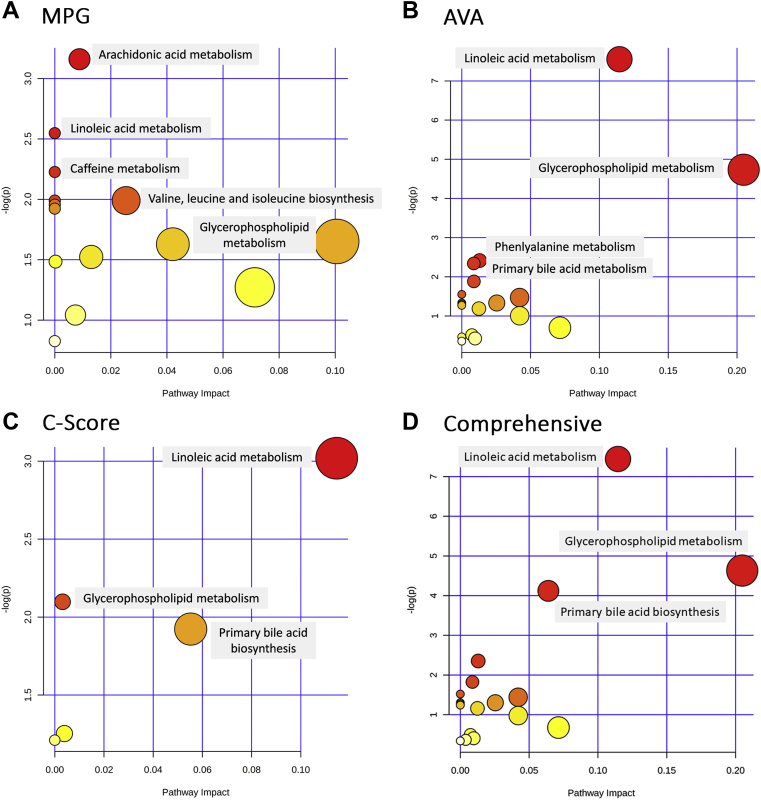
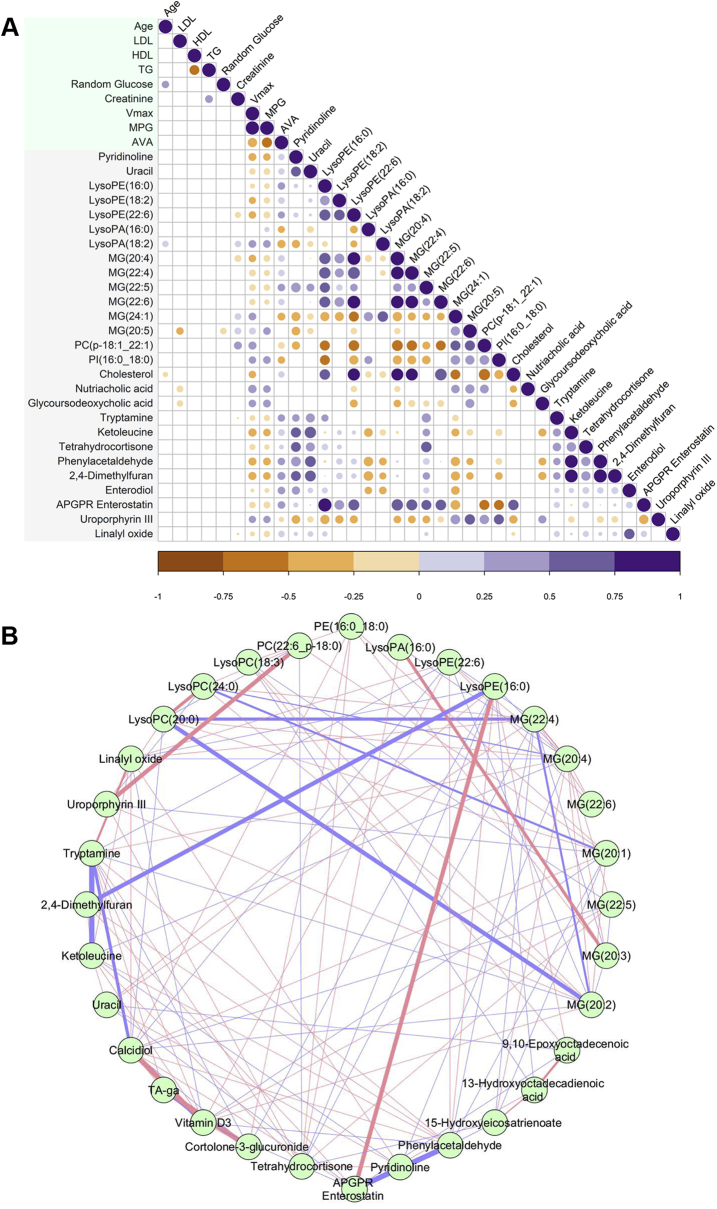
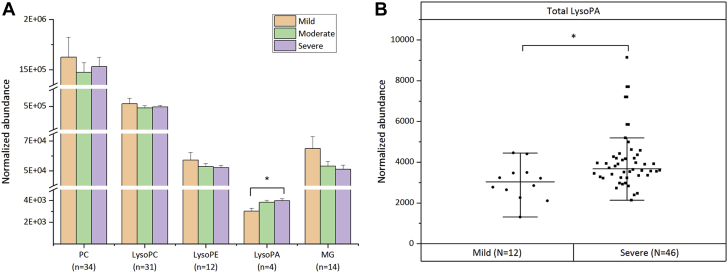
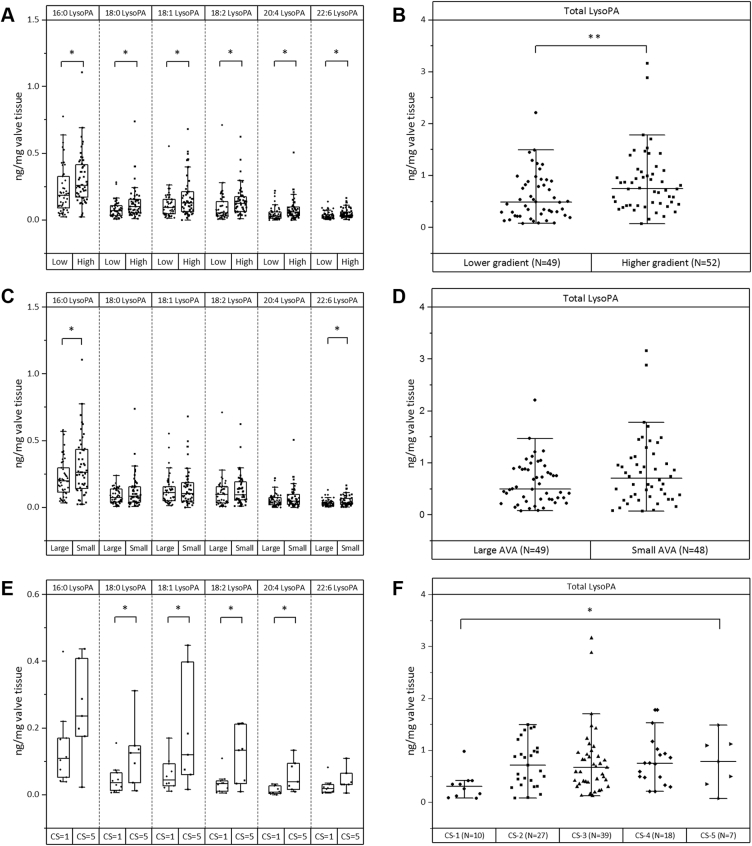
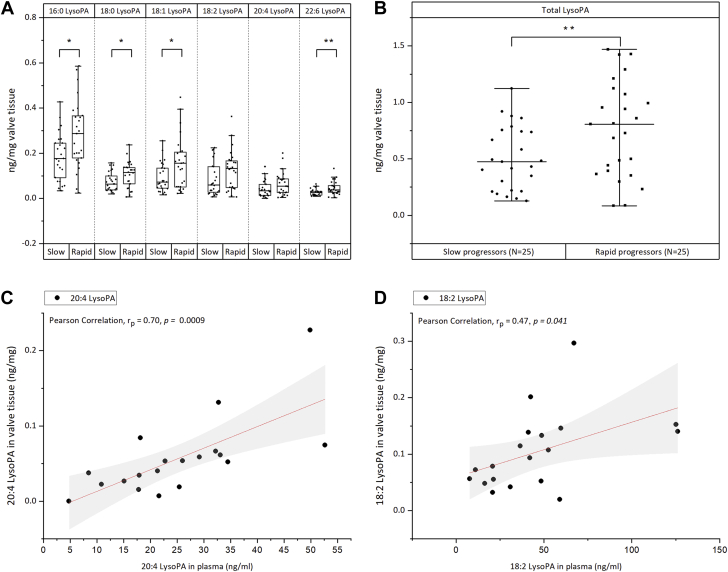
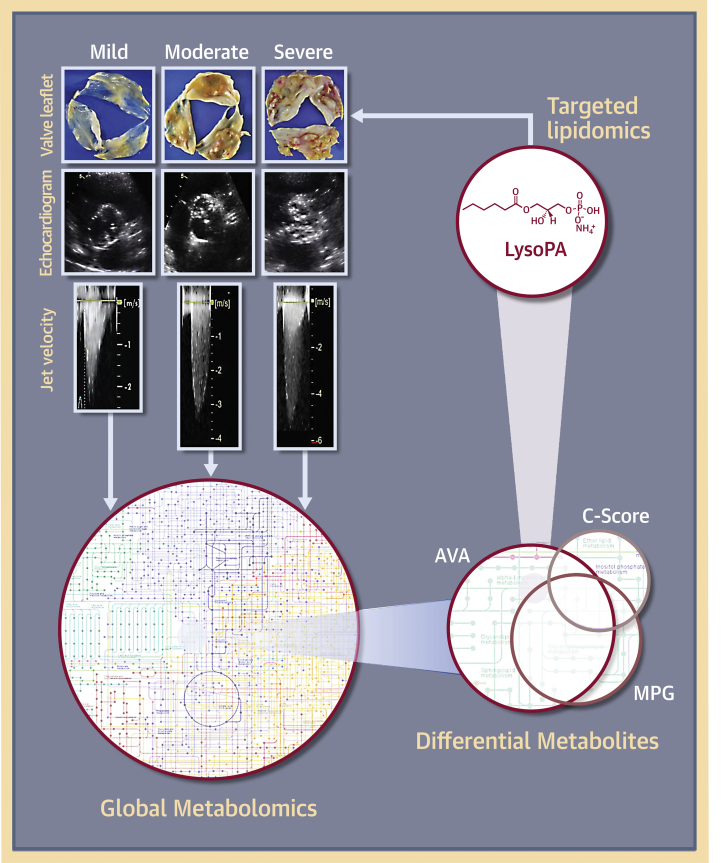
This study outlines the first step toward creating the metabolite atlas of human calcified aortic valves by identifying the expression of metabolites and metabolic pathways involved at various stages of calcific aortic valve stenosis progression. Untargeted analysis identified 72 metabolites and lipids that were significantly altered (p < 0.01) across different stages of disease progression. Of these metabolites and lipids, the levels of lysophosphatidic acid were shown to correlate with faster hemodynamic progression and could select patients at risk for faster progression rate.

Keywords: AS, aortic stenosis; ATX, autotaxin; AV, aortic valve; AVA, aortic valve area; BAV, bicuspid aortic valve; CAVS, calcific aortic valve stenosis; CV, correlation of variation; Lp(a), lipoprotein(a); LysoPA, lysophosphatidic acid; LysoPC, lysophosphatidylcholine; LysoPE, lysophosphatidylethanolamine; MG, monoglyceride; MPG, mean pressure gradient; PC, phosphatidylcholine; QC, quality control; TAV, tricuspid aortic valve; Vmax, peak aortic jet velocity; aortic stenosis; calcific aortic valve stenosis; lysophosphatidic acids; nontargeted metabolomics; targeted lipidomics; valvular calcification.


Conflict of interest statement

Dr. Ravandi is supported by a grant from Research Manitoba and Heart and Stroke Foundation of Canada. Mr. Surendran is supported by Research Manitoba Master’s Studentship (2018), Bank of Montreal/Institute of Cardiovascular Sciences Studentship (2019), and Singal, Pawan K. Graduate Scholarship in Cardiovascular Sciences (2019). All other have reported that they have no relationships relevant to the contents of this paper to disclose.

Figures

None
Graphical abstract
Figure 1
Figure 1
Metabolite Atlas of CAVS (A) Summary of metabolomics workflow depicting the observed number of molecular entities (features) with a unique m/z and retention time obtained from each mode of chromatographic separation (a), features with correlation of variation (CV) <30% in quality control (QC) samples (b), putatively annotated compounds in the Human Metabolome Database (c), unique metabolites after removal of duplicates (d), and differential metabolites (i.e., CV among QC samples <30%; p < 0.01, and fold change >2) (e) across different grades (mild, moderate, and severe) of calcific aortic valve stenosis (CAVS) severity. (B) Number of differential metabolites that were shared or unique based on different methods of determining the severity of aortic stenosis: mean pressure gradient (MPG), aortic valve area (AVA), and aortic valve calcification score (C-score). (C) Classification of differential metabolites (N = 72) according to their chemical class. (D) Subclassification hierarchy of identified lipids (N = 51). BHT = butylated hydroxytoluene; ESI = electrospray ionization; HILIC = hydrophilic interaction liquid chromatography; LysoPA = lysophosphatidic acid; RPLC = reverse phase liquid chromatography.
Figure 2
Figure 2
Hierarchical Clustering Heat Map of Clinically Relevant Metabolites/Lipids in AV Leaflets Heat map showing differential metabolite/lipid abundance levels across different grades of stenotic severity as determined by AVA (N = 62) (A), MPG (N = 28) (B), and C-score (N = 19) (C). Rows indicate metabolites/lipids; columns indicate disease severity. Color code indicates compound abundance.∗Compounds that were identified by all 3 different ways of determining stenotic severity (AVA, MPG, and C-score). N = number of differential metabolites/lipids across different grades of stenotic severity. AV = aortic valve; other abbreviations as in Figure 1.
Figure 3
Figure 3
Metabolomics Pathway Analysis “Metabolome view” from pathway analysis showing the altered metabolic pathways that are representative of differential metabolites/lipids (N) as determined by MPG (N = 28) (A), AVA (N = 62) (B), C-score (N = 19) (C), and by combining MPG, AVA, and C-score (N = 72) (D). Each circle represents a pathway, and the size and color of each circle was based on pathway impact value and significance, with red being most significantly associated with stenotic severity. N = number of differential metabolites/lipids across different grades of stenotic severity. The p value was calculated from the enrichment analysis, and the impact value was calculated from pathway topology analysis. Abbreviations as in Figure 1.
Figure 4
Figure 4
Metabolite-Clinical Parameter and Metabolite-Metabolite Correlation Analysis (A) Differential metabolites/lipids were correlated with clinical parameters. Positive correlations are displayed in purple and negative correlations in orange. Color intensity and size of the circle are proportional to the correlation coefficients (Spearman correlation). In this correlogram, correlations with p > 0.05 are considered insignificant and are left blank. Only those metabolites or lipids (27) having more than 1 significant correlation (p < 0.05) with any of the 3 hemodynamic parameters—peak aortic jet velocity (Vmax), MPG, and AVA—were used to construct the correlogram. (B) Network plot highlighting the highly correlated metabolites/lipids. The nodes represent compounds, and the edges represent biochemical reactions. The thickness of the edges represents the strength of the correlations. The connections between the nodes were established by Pearson correlation (|rp| > 0.8). Positive correlations are displayed in pink and negative correlations in violet. APGR = Ala-Pro-Gly-Pro-Arg; HDL = high-density lipoprotein; LDL = low-density lipoprotein; LysoPA = lysophosphatidic acid; LysoPE = lysophosphatidylethanolamine; MG = monoglyceride; PC = phosphatidylcholine; PI = Phosphatidylinositol; TA-ga = Tetrahydroaldosterone-3-glucuronide; TG = triglyceride; other abbreviations as in Figure 1.
Figure 5
Figure 5
Differential Abundance of Highly Correlated Lipid Classes in Nontargeted Mode (A) Bar chart showing total PC, lysophosphatidylcholine (LysoPC), LysoPE, LysoPA, and MG amounts in mild (N = 12), moderate (N = 36), and severe (N = 46) grade stenotic valves. Data are the average normalized abundance of all putatively identified species (n) in a particular lipid class ± SEM of 96 valve samples. (B) Boxplot chart showing total LysoPA amount (average normalized abundance of 4 putatively identified LysoPA species) in mild (N = 12) and severe (N = 46) cohorts. ∗Significant post hoc differences at p < 0.05 after Tukey adjustment following analysis of variance or independent Student’s t-test. n = number of species in each lipid class; N = number of samples in each category; other abbreviations as in Figure 4.
Figure 6
Figure 6
LysoPA Species in Valve Leaflets by Targeted LC/MS/MS Analysis (A) Amount of LysoPA species (16:0, 18:0, 18:1, 18:2, 20:4 and 22:6) in low-gradient (Low) and high-gradient (High) groups. Grouping was performed based on median MPG of the cohort. (B) Total LysoPA amounts (sum of 16:0, 18:0, 18:1, 18:2, 20:4, and 22:6 LysoPA) per milligram of valve tissue extracted in Low (N = 49) and High (N = 52) groups. (C) Amount of LysoPA species (16:0, 18:0, 18:1, 18:2, 20:4, and 22:6) in large AVA (Large) and small AVA (Small) groups. Grouping was performed based on median AVA of the cohort. (D) Total LysoPA amounts (sum of 16:0, 18:0, 18:1, 18:2, 20:4, and 22:6 LysoPA) per milligram of valve tissue extracted in Large (N = 49) and Small (N = 48) groups. (E) Amount of LysoPA species (16:0, 18:0, 18:1, 18:2, 20:4, and 22:6) in 2 extremes of the 5-grade scoring system for valve calcification (C-score = 1 and C-score = 5). (F) Total LysoPA amounts (sum of 16:0, 18:0, 18:1, 18:2, 20:4, and 22:6 LysoPA) per milligram of valve tissue extracted in different grades of valve calcification. Statistical significance at ∗p < 0.05 and ∗∗p < 0.01 after Tukey adjustment following analysis of variance or independent Student’s t-test. CS = calcification score; LC-ESI-MS/MS = liquid chromatography electrospray ionization tandem mass spectrometry; other abbreviations as in Figures 1 and 4.
Figure 7
Figure 7
LysoPA Relationship to Aortic Stenosis Progression and Its Diagnostic Potential (A) Amount of lysophosphatidic acid (LysoPA) species (16:0, 18:0, 18:1, 18:2, 20:4, and 22:6) in slow and rapid progressors. Grouping was performed based on the median Vmax (rate of progression per year). (B) Total LysoPA amounts (sum of 16:0, 18:0, 18:1, 18:2, 20:4, and 22:6 LysoPA) per milligram of valve tissue extracted in slow (N = 25) and rapid (N = 25) progressors. (C, D) Pearson correlation (rp) between tissue levels and plasma levels of 20:4 LysoPA (C) and 18:2 LysoPA (D). ∗ and ∗∗ indicate statistical significance at p < 0.05 and p < 0.01 respectively after Student's t-test.
Figure 8
Figure 8
Metabolomics of CAVS in Humans Schematic diagram showing representative images of explanted aortic valve leaflets, echocardiograms, and jet velocities in patients with varying degrees (mild, moderate, and severe) of calcific aortic valve stenosis (CAVS) severity and subsequent metabolomics workflow. Abbreviations as in Figures 1 and 4.

Comment in

References

    1. Nkomo V.T., Gardin J.M., Skelton T.N., Gottdiener J.S., Scott C.G., Enriquez-Sarano M. Burden of valvular heart diseases: a population-based study. Lancet. 2006;368:1005–1011. - PubMed
    1. Baumgartner H., Falk V., Bax J.J., ESC Scientific Document Group 2017 ESC/EACTS Guidelines for the management of valvular heart disease. Eur Heart J. 2017;38:2739–2791. - PubMed
    1. Arsenault B.J., Boekholdt S.M., Dubé M.P. Lipoprotein(a) levels, genotype, and incident aortic valve stenosis: a prospective Mendelian randomization study and replication in a case-control cohort. Circ Cardiovasc Genet. 2014;7:304–310. - PubMed
    1. Kamstrup P.R., Tybjaerg-Hansen A., Nordestgaard B.G. Elevated lipoprotein(a) and risk of aortic valve stenosis in the general population. J Am Coll Cardiol. 2014;63:470–477. - PubMed
    1. Schlotter F., Halu A., Goto S. Spatiotemporal multi-omics mapping generates a molecular atlas of the aortic valve and reveals networks driving disease. Circulation. 2018;138:377–393. - PMC - PubMed