

Impaired host response and the presence of Acinetobacter baumannii in the serum microbiome of type-II diabetic patients
- PMID: 33426512
- PMCID: PMC7779772
- DOI: 10.1016/j.isci.2020.101941
Impaired host response and the presence of Acinetobacter baumannii in the serum microbiome of type-II diabetic patients
Abstract
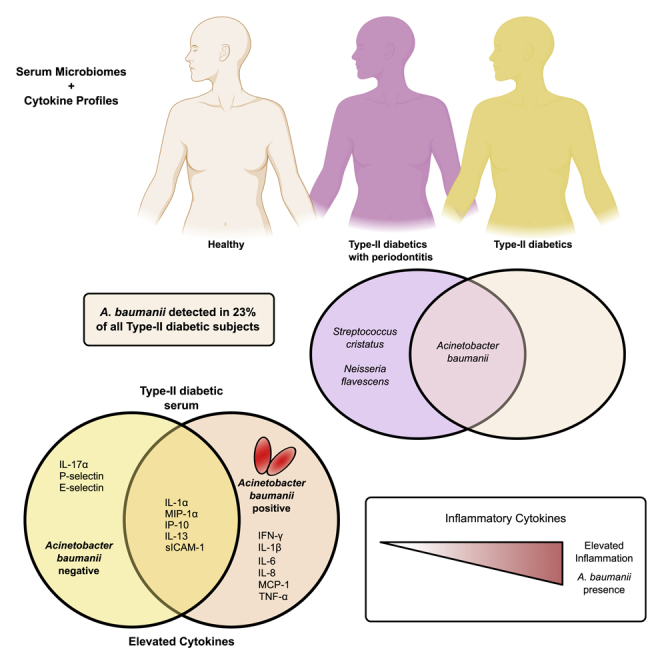
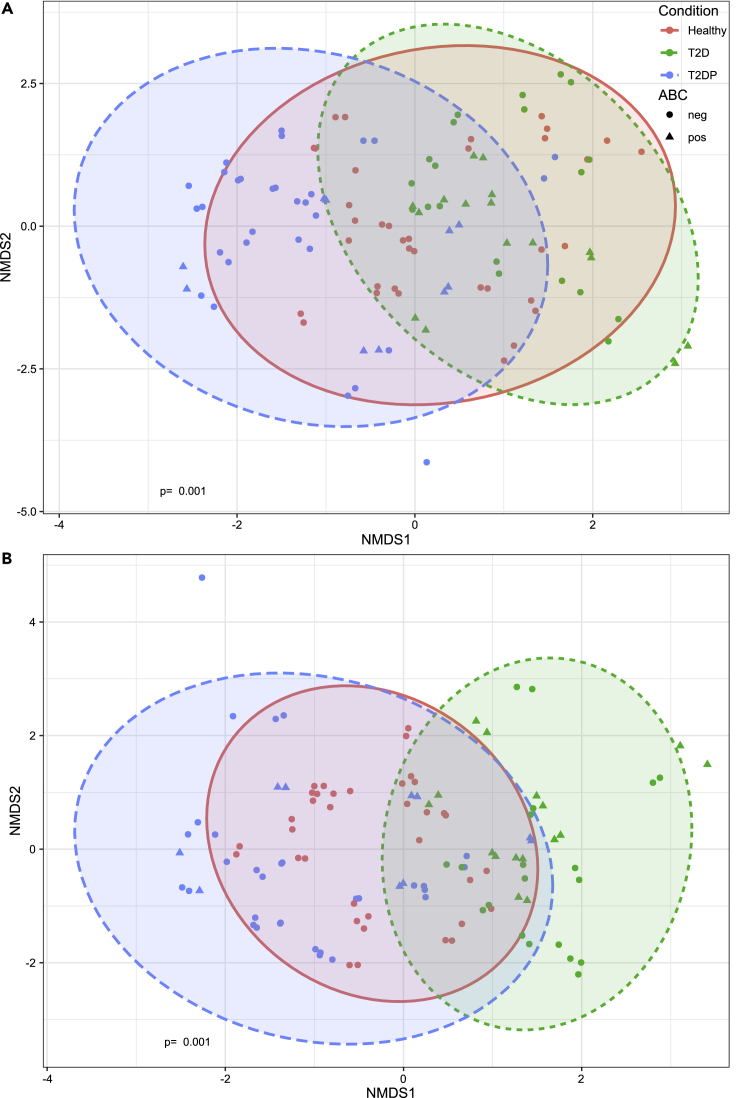
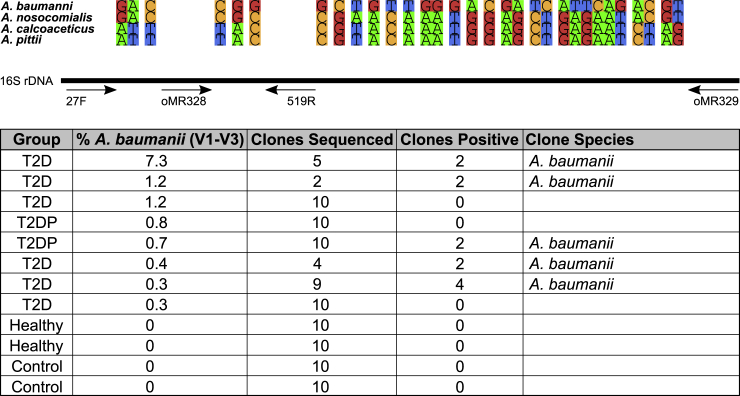
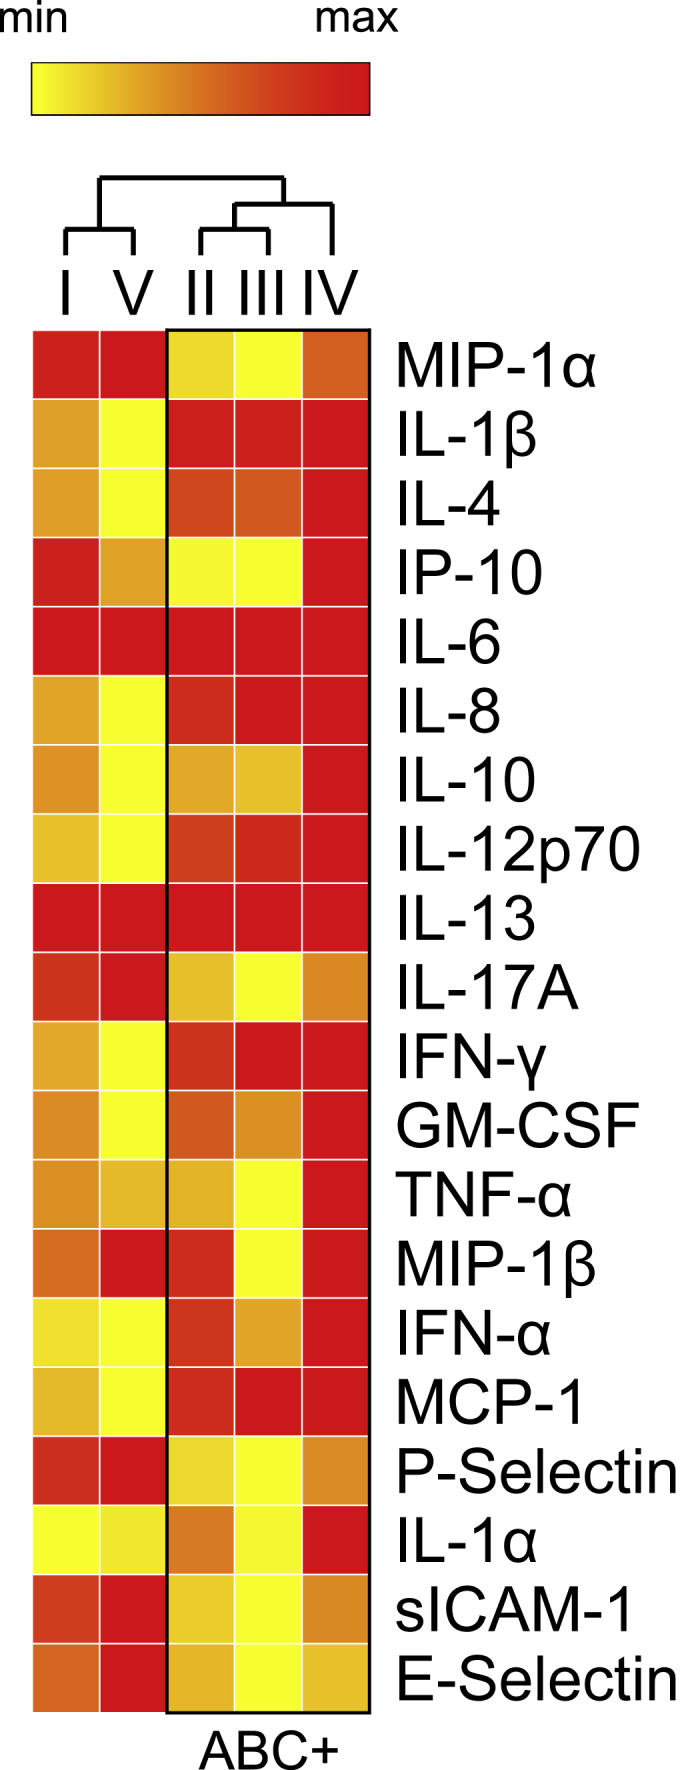
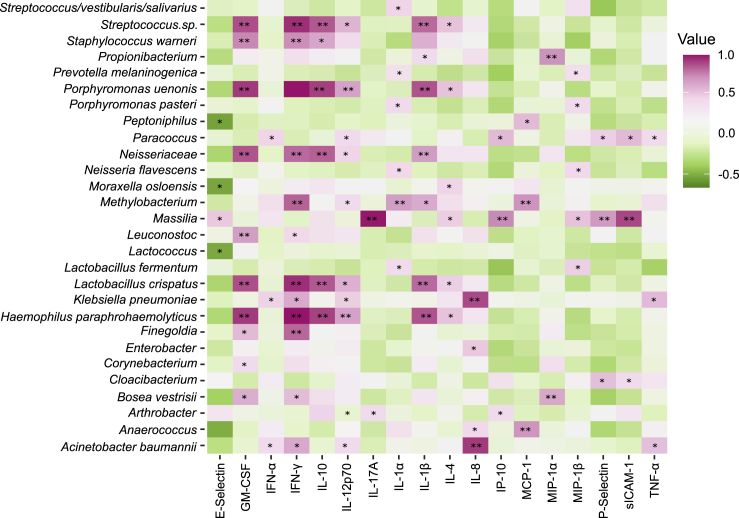
Type II diabetes (T2D) affects over 10% of the US population and is a growing disease worldwide that manifests with numerous comorbidities and defects in inflammation. This dysbiotic host response allows for infection of the host by numerous microorganisms. In the course of T2D disease, individuals can develop chronic infections including foot ulcers and periodontitis, which lead to further complications and opportunistic infections in multiple body sites. In this study, we investigated the serum of healthy subjects and patients with T2D with (T2DP) or without periodontitis for both microbiome signatures in addition to cytokine profiles. Surprisingly, we detected the presence of Acinetobacter baumanii in the serum of 23% individuals with T2D/T2DP tested. In T2DP, IL-1β, TNF-α, MCP-1, IL-6, IL-8, and IFN-γ were significantly elevated in ABC-positive subjects. As an emerging pathogen, A. baumanii infection represents a risk for impaired inflammation and the development of comorbidities in subjects with T2D.
Keywords: Human Metabolism; Microbiology.
© 2020 The Authors.
Conflict of interest statement
The authors declare no competing interests.
Figures
Similar articles
-
Studies on periodontitis and analyses of individuals at risk for periodontal diseases.Swed Dent J Suppl. 2006;(180):5-49. Swed Dent J Suppl. 2006. PMID: 16838563
-
Relationship between clinical parameters and cytokine profiles in inflamed gingival tissue and serum samples from patients with chronic periodontitis.J Clin Periodontol. 2003 Dec;30(12):1046-52. doi: 10.1046/j.0303-6979.2003.00425.x. J Clin Periodontol. 2003. PMID: 15002890
-
Impaired early cytokine responses at the site of infection in a murine model of type 2 diabetes and melioidosis comorbidity.Infect Immun. 2013 Feb;81(2):470-7. doi: 10.1128/IAI.00930-12. Epub 2012 Dec 3. Infect Immun. 2013. PMID: 23208607 Free PMC article.
-
Cytokine profile in the gingival crevicular fluid of periodontitis patients with and without type 2 diabetes: a literature review.J Periodontol. 2012 Feb;83(2):156-61. doi: 10.1902/jop.2011.110207. Epub 2011 Jun 21. J Periodontol. 2012. PMID: 21692634 Review.
-
Expression of inflammatory mediators in periodontitis and T2D patients: a systematic review and meta-analysis.Braz Oral Res. 2022 Jul 11;36:e098. doi: 10.1590/1807-3107bor-2022.vol36.0098. eCollection 2022. Braz Oral Res. 2022. PMID: 35830142
Cited by
-
Major alteration of lung microbiome and the host responses in critically ill COVID-19 patients with high viral load.Sci Rep. 2024 Nov 12;14(1):27637. doi: 10.1038/s41598-024-78992-1. Sci Rep. 2024. PMID: 39532981 Free PMC article.
-
Major alteration of Lung Microbiome and the Host Reaction in critically ill COVID-19 Patients with high viral load.Res Sq [Preprint]. 2024 Mar 8:rs.3.rs-3952944. doi: 10.21203/rs.3.rs-3952944/v1. Res Sq. 2024. Update in: Sci Rep. 2024 Nov 12;14(1):27637. doi: 10.1038/s41598-024-78992-1. PMID: 38496464 Free PMC article. Updated. Preprint.
-
Urinary tract infection in patients with diabetes mellitus and the role of parental genetics in the emergence of the disease.J Med Life. 2022 Aug;15(8):955-962. doi: 10.25122/jml-2021-0331. J Med Life. 2022. PMID: 36188660 Free PMC article.
-
Blood Microbiome Analysis Reveals Biomarkers of Treatment Response in Drug-Naïve Patients with First-Episode Psychosis: A Pilot Study.Microorganisms. 2025 Aug 19;13(8):1935. doi: 10.3390/microorganisms13081935. Microorganisms. 2025. PMID: 40871439 Free PMC article.
-
Diabetes Mellitus and Multidrug-Resistant Gram-Negative Bacterial Infections in Critically Ill COVID-19 Patients: A Retrospective Observational Study.Diagnostics (Basel). 2025 May 8;15(10):1190. doi: 10.3390/diagnostics15101190. Diagnostics (Basel). 2025. PMID: 40428183 Free PMC article.
References
-
- American Diabetes Association (2) Classification and diagnosis of diabetes. Diabetes Care. 2015;38:S8–S16. - PubMed
-
- Armitage G.C. Development of a classification system for periodontal diseases and conditions. Ann. Periodontol. 1999;4:1–6. - PubMed
-
- National diabetes Statistics Report | data & Statistics | diabetes | CDC (2020). https://www.cdc.gov/diabetes/data/statistics/statistics-report.html
Grants and funding
LinkOut - more resources
Full Text Sources
Other Literature Sources
Research Materials
Miscellaneous
