Root endophyte induced plant thermotolerance by constitutive chromatin modification at heat stress memory gene loci
- PMID: 33426785
- PMCID: PMC7926228
- DOI: 10.15252/embr.202051049
Root endophyte induced plant thermotolerance by constitutive chromatin modification at heat stress memory gene loci
Abstract
Global warming has become a critical challenge to food security, causing severe yield losses of major crops worldwide. Conventional and transgenic breeding strategies to enhance plant thermotolerance are laborious and expensive. Therefore, the use of beneficial microbes could be an alternative approach. Here, we report that the root endophyte Enterobacter sp. SA187 induces thermotolerance in wheat in the laboratory as well as in open-field agriculture. To unravel the molecular mechanisms, we used Arabidopsis thaliana as model plant. SA187 reprogramed the Arabidopsis transcriptome via HSFA2-dependent enhancement of H3K4me3 levels at heat stress memory gene loci. Unlike thermopriming, SA187-induced thermotolerance is mediated by ethylene signaling via the transcription factor EIN3. In contrast to the transient chromatin modification by thermopriming, SA187 induces constitutive H3K4me3 modification of heat stress memory genes, generating robust thermotolerance in plants. Importantly, microbial community composition of wheat plants in open-field agriculture is not influenced by SA187, indicating that beneficial microbes can be a powerful tool to enhance thermotolerance of crops in a sustainable manner.
Keywords: EIN3; HSFA2; endophyte; memory gene; thermotolerance.
© 2021 The Authors. Published under the terms of the CC BY NC ND 4.0 license.
Conflict of interest statement
The authors declare that they have no conflict of interest.
Figures

The phenotype of non‐colonized (Mock) and SA187‐colonized (187) 5‐day‐old wheat seedlings after HS treatment at 44°C for 2 h.
Fresh weight quantification of 9‐day‐old wheat seedlings upon 44°C heat stress (HS) and 22°C normal (NHS) conditions (without and with SA187) after 3 days of recovery at 22°C.
Plant biomass of wheat obtained upon cultivation with and without SA187 in three consecutive growing seasons of open‐field agriculture.
Experimental scheme of heat experiments and phenotype of Arabidopsis seedlings with and without SA187. Top, plants with long‐term acquired thermotolerance (LAT) treatment: 9‐day‐old plants that were grown at 22°C were treated at 37°C for 3 h and then returned to 22°C for 2 day. At day 11, plants were heat‐stressed at 44°C for 30 min and incubated for recovery at 22°C. Middle, plants with HS treatment: 11‐day‐old plants that were grown at 22°C were treated at 44°C for 30 min and incubated for recovery at 22°C. Bottom, plants with NHS treatment: control plants were grown in parallel at 22°C for 15 days.
Fresh weight of 15‐day‐old plants with and without SA187 under NHS, HS, and LAT temperature regimes.
Percent survival of 15‐day‐old plants with and without SA187 under NHS, HS, and LAT conditions.
Percentage of bleached and green leaves of 15‐day‐old plants with and without SA187 under NHS, HS, and LAT conditions.

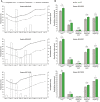
Meteorological data at ICBA (Dubai, UAE) during three growing seasons (2014–2015, 2016–2017, and 2017–2018).
Quantitative measurements of wheat plant height, spike length, number of spikes/plant, number of seeds/plant, and weight of 1,000 grains collected from SA187‐treated and non‐treated wheat plants, and % of increase are indicated. Asterisks indicate a statistical difference based on the on Mann–Whitney test (*P < 0.05). Error bars indicate SE.

- A, B
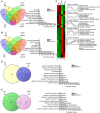
Venn diagrams representing the number of up‐ and down‐regulated DEGs in response to HS (HS, LAT) with and without SA187 compared to NHS and NHS + 187. The histograms show enriched GO terms for unique up‐ and down‐regulated HS DEGs when compared to NHS.
- C
Hierarchical clustering of up‐ and down‐regulated DEGs in Arabidopsis in response to HS and HS + 187 treatments. For every gene, FPKM values were normalized. Red bars denote an increase, while green bars indicate a decrease in expression for a given gene. For the most relevant clusters, gene families significantly enriched are indicated based on gene ontology. The pink line in each cluster indicates an overall trend of differentially expressed genes in a particular cluster for different treatments.
- D, E
Venn diagrams showing the number of commonly up‐regulated (D) and down‐regulated (E) DEGs in response to HS + 187 and LAT in comparison to HS. The histograms represent the enriched GO terms associated with the DEGs.

- A, B
Histograms showing enriched GO terms for common DEGs (A) up‐ and (B) down‐regulated genes in HS vs. NHS, LAT vs. NHS, HS + 187 vs. NHS + 187, LAT + 187 vs. NHS + 187.
- C, D
Histograms showing enriched GO terms for DEGs (C) up‐ and (D) down‐regulated genes in LAT vs. HS‐treated plants.


- A, B
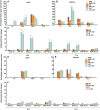
Dynamics of HSFA2 and HSP101 transcript levels in control (NHS, NHS + 187), 44°C heat‐stressed non‐colonized and SA187‐colonized (HS, HS + 187), thermoprimed (LAT), and thermoprimed and SA187‐colonized plants (LAT + 187) at 1, 24, 48, 72, and 96 h of recovery at 22°C. SA187‐colonized (HS + 187) and thermoprimed (LAT) plants showed higher transcript levels in comparison to plants exposed at 44°C HS for 30 min (HS) after 1 h of recovery at 22°C.
- C, D
Transcript levels of heat stress memory genes HSP18.1 and APX2 in control plants (NHS, NHS + 187), 44°C heat‐stressed non‐colonized and SA187‐colonized (HS, HS + 187), thermoprimed (LAT), and thermoprimed SA187‐colonized plants (LAT + 187) at 1, 24, 48, 72, and 96 h of recovery at 22°C. Transcript levels were normalized to tubulin as reference gene, and the respective 22°C NHS plants were harvested at the same time points. All treatments are compared with direct 44°C HS treatment for statistical significance.
- E
Schematic representation of the experimental set‐up and sampling times for ChIP‐PCR. 9‐day‐old plants were thermoprimed at 37°C for 3 h before incubation at 22°C for 24 h or 72 h.
- F
APX2 and HSP18.2 gene models drawn to scale (gray boxes, 5′ untranslated region; orange boxes, exons; angled arrow, transcription start site). The underneath numbers with gray bar indicate the positioning of regions analyzed for ChIP‐PCR, three regions of APX2 and 2 regions of HSP18.2.
- G
Relative enrichment of H3K4me3 at APX2 and HSP18.2 in control non‐primed (NP), SA187‐colonized non‐primed plants (NP + 187), 37°C‐primed (P), and 37°C‐primed SA187‐colonized plants (P + 187) at 24 and 72 h after priming as determined by chromatin immunoprecipitation‐qPCR for the indicated regions of APX2 and HSP18.2. Amplification values were normalized to input and H3 and region 1 of non‐primed (NP) plants.

- A
Phenotypes of SA187‐colonized or non‐colonized wild‐type Col‐0, hsfa2, hsfa1q, and ein3‐1 mutant plants upon long‐term acquired thermotolerance treatment (LAT): 9‐day‐old plants without and with SA187 (LAT, LAT + 187) were treated at 37°C for 3 h and then returned to 22°C for 2 days. At day 11, plants were heat‐stressed at 44°C for 30 min and incubated for recovery at 22°C; or direct heat stress treatment (HS): 11‐day‐old plants without and with SA187 (HS, HS + 187) were treated at 44°C for 30 min and incubated for recovery at 22°C.
- B, C
Fresh weight and percent survival of Col‐0, hsfa2, hsfa1q, and ein3‐1 plants in HS, HS + 187, LAT, and LAT + 187 treatments. Due to the dwarf size of hsfa1q mutants, LAT treatment was performed on day 18 and HS at day 20. All treatments are compared with plants upon 44°C HS.
- D
Fresh weight of 1 µM 1‐aminocyclopropane‐1‐carboxylic acid (ACC)‐treated wild‐type plants. 5‐day‐old plants were transferred to 1 µM ACC containing plates, and 11‐day‐old plants were HS‐treated at 44°C for 30 min before recovery at 22°C for 3 days (HS, HS + ACC). LAT: 9‐day‐old plants without and with ACC treatment (LAT, LAT + ACC) were primed for 3 h at 37°C before incubation for 2 days at 22°C, and further heat stress of 44°C was performed at day 11 for 30 min
- E
Percent survival of Col‐0 plants with and without ACC under HS, HS + ACC, LAT, and LAT + ACC conditions.
- F
Fresh weight of hsfa2 and control Col‐0 plants treated with and without ACC under non‐heat stress condition (NHS, NHS + ACC) of 22°C and heat stress (HS, HS + ACC) condition of 44°C for 30 min. Percent survival was scored at day 4 of recovery from 44°C heat stress. All treatments were compared with plants upon HS.

- A
Fresh weight of SA187‐colonized or non‐colonized wild‐type (Col‐0), hsfa2, hsfa1q, and ein3‐1 mutant plants under control conditions at 22°C (NHS).
- B–D
Bleaching (bottom) and green leaves (top) quantification in wild‐type, hsfa2, and ein3‐1 mutant plants in NHS, NHS + 187, HS, HS + 187, LAT, and LAT + 187 plants (average of three biological repeats with 12 plants each biological repeat; n = 36 plants). Due to dwarf and sick phenotype of hsfa1q plants, numbers of bleached and green leaves were not scored. All treatments were compared with plants after direct 44°C HS treatment.


- A, B
Transcript levels of HS memory genes HSP18.2 and APX2 in ein3‐1 non‐heat‐stressed (NHS, NHS + 187), 44°C heat‐stressed SA187‐colonized (HS + 187), thermoprimed (LAT), and thermoprimed SA187‐colonized plants (LAT + 187) at 1, 24, 48, 72, and 96 h of recovery at 22°C.
- C
Relative enrichment of H3K4me3 at APX2 and HSP18.2 in control non‐primed (NP), SA187‐colonized non‐primed plants (NP + 187), 37°C‐primed (P), and 37°C‐primed SA187‐colonized plants (P + 187) at 24 and 72 h after priming as determined by chromatin immunoprecipitation‐qPCR for the indicated regions of APX2 and HSP18.2 (Fig 3F).
- D, E
Transcript levels of HS memory genes HSP18.2 and APX2 in hsfa2 mutant.
- F
Relative enrichment of H3K4me3 levels at APX2 and HSP18.2 memory genes in hsfa2 mutant.

Principal component analysis (PCA) of microbiome samples from soil (S) and the endosphere of wheat roots without (R‐mock) and with SA187 treatment (R‐187). The first component (PC1) explains 67% of the total variance, while PC2 represents 10%.
Relative percent abundance of bacterial phyla in the soil and the wheat root endosphere without (R‐mock) and with SA187 treatment (R‐187).
Bacterial family abundance in the soil and the wheat root endosphere without (R‐mock) and with SA187 (R‐187).

Comment in
-
Tango between Ethylene and HSFA2 Settles Heat Tolerance.Trends Plant Sci. 2021 May;26(5):429-432. doi: 10.1016/j.tplants.2021.03.003. Epub 2021 Mar 17. Trends Plant Sci. 2021. PMID: 33744161
Similar articles
-
Multiple strategies of plant colonization by beneficial endophytic Enterobacter sp. SA187.Environ Microbiol. 2021 Oct;23(10):6223-6240. doi: 10.1111/1462-2920.15747. Epub 2021 Sep 15. Environ Microbiol. 2021. PMID: 34472197
-
Two interacting ethylene response factors regulate heat stress response.Plant Cell. 2021 Apr 17;33(2):338-357. doi: 10.1093/plcell/koaa026. Plant Cell. 2021. PMID: 33793870 Free PMC article.
-
PIF4 Promotes Expression of HSFA2 to Enhance Basal Thermotolerance in Arabidopsis.Int J Mol Sci. 2022 May 27;23(11):6017. doi: 10.3390/ijms23116017. Int J Mol Sci. 2022. PMID: 35682701 Free PMC article.
-
Beat the heat: plant- and microbe-mediated strategies for crop thermotolerance.Trends Plant Sci. 2022 Aug;27(8):802-813. doi: 10.1016/j.tplants.2022.02.008. Epub 2022 Mar 21. Trends Plant Sci. 2022. PMID: 35331665 Review.
-
Progress in Research on the Mechanisms Underlying Chloroplast-Involved Heat Tolerance in Plants.Genes (Basel). 2021 Aug 28;12(9):1343. doi: 10.3390/genes12091343. Genes (Basel). 2021. PMID: 34573325 Free PMC article. Review.
Cited by
-
An invasive weed-associated bacteria confers enhanced heat stress tolerance in wheat.Heliyon. 2022 Jul 6;8(7):e09893. doi: 10.1016/j.heliyon.2022.e09893. eCollection 2022 Jul. Heliyon. 2022. PMID: 35865978 Free PMC article.
-
What Did We Learn From Current Progress in Heat Stress Tolerance in Plants? Can Microbes Be a Solution?Front Plant Sci. 2022 May 23;13:794782. doi: 10.3389/fpls.2022.794782. eCollection 2022. Front Plant Sci. 2022. PMID: 35677244 Free PMC article. Review.
-
Phyllosphere symbiont promotes plant growth through ACC deaminase production.ISME J. 2023 Aug;17(8):1267-1277. doi: 10.1038/s41396-023-01428-7. Epub 2023 Jun 1. ISME J. 2023. PMID: 37264153 Free PMC article.
-
Habitat-adapted microbial communities mediate Sphagnum peatmoss resilience to warming.New Phytol. 2022 Jun;234(6):2111-2125. doi: 10.1111/nph.18072. Epub 2022 Mar 28. New Phytol. 2022. PMID: 35266150 Free PMC article.
-
Exploring plant-microbe interactions in adapting to abiotic stress under climate change: a review.Front Plant Sci. 2024 Nov 15;15:1482739. doi: 10.3389/fpls.2024.1482739. eCollection 2024. Front Plant Sci. 2024. PMID: 39619840 Free PMC article. Review.
References
-
- Abd El‐Daim IA, Bejai S, Meijer J (2014) Improved heat stress tolerance of wheat seedlings by bacterial seed treatment. Plant Soil 379: 337–350
-
- Alzubaidy H, Essack M, Malas TB, Bokhari A, Motwalli O, Kamanu FK, Jamhor SA, Mokhtar NA, Antunes A, Simões MF et al (2016) Rhizosphere microbiome metagenomics of gray mangroves (Avicennia marina) in the Red Sea. Gene 576: 626–636 - PubMed
-
- Andrews S (2012) Babraham Bioinformatics – FastQC A Quality Control tool for High Throughput Sequence Data. https://www.bioinformatics.babraham.ac.uk/projects/fastqc/
-
- Avramova Z (2015) Transcriptional ‘memory’ of a stress: transient chromatin and memory (epigenetic) marks at stress‐response genes. Plant J 83: 149–159 - PubMed
Publication types
MeSH terms
Substances
Associated data
- Actions
LinkOut - more resources
Full Text Sources
Other Literature Sources
Molecular Biology Databases

